


Introduction
Atomic spectra refer to the set of characteristic frequencies or wavelengths of electromagnetic radiation that atoms emit or absorb when electrons transition between energy levels. These spectra appear as distinct lines when light from atoms is analyzed using a spectroscope. Each element produces a unique spectral pattern, which acts like a fingerprint for identifying that element.
Atomic spectra are fundamental in understanding the structure of atoms and played a crucial role in the development of modern atomic theory and quantum mechanics. The study of spectral lines revealed that atoms possess discrete energy levels and that energy exchanges occur in quantized amounts.
One of the most important contributions to the understanding of atomic spectra came from scientists such as Niels Bohr, Johann Balmer, Johannes Rydberg, and Max Planck.
Atomic spectra are widely used in fields such as astronomy, chemistry, plasma physics, and materials science to determine the composition and physical conditions of matter.
Nature of Atomic Spectra
Atoms consist of a nucleus surrounded by electrons occupying discrete energy levels. When electrons move between these levels, they either absorb or emit photons of specific energies.
The energy of the emitted or absorbed radiation is given by:
[
E = hf
]
where:
- (E) = energy of the photon
- (h) = Planck’s constant
- (f) = frequency of radiation
Because electrons can occupy only certain energy levels, the emitted or absorbed radiation forms distinct spectral lines rather than continuous spectra.
Types of Spectra
Spectra can generally be classified into three main types.
Continuous Spectrum


A continuous spectrum contains all wavelengths of visible light without gaps.
It is produced by:
- Hot solids
- Hot liquids
- Dense gases
Examples include light emitted by:
- Incandescent bulbs
- The Sun’s photosphere
In a continuous spectrum, the colors blend smoothly from red to violet.
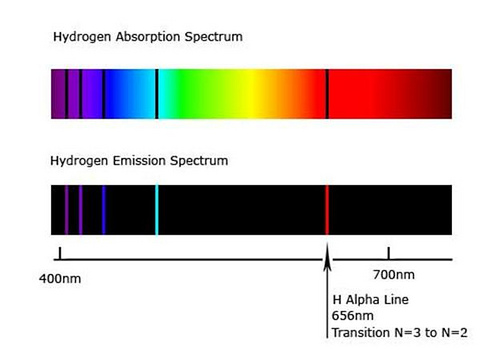
Emission Spectrum


An emission spectrum is produced when excited atoms emit light at specific wavelengths.
Characteristics:
- Appears as bright colored lines on a dark background
- Each element has a unique pattern of spectral lines
Emission spectra are generated when:
- Atoms absorb energy
- Electrons move to higher energy levels
- Electrons return to lower levels and emit photons
Gas discharge tubes are commonly used to produce emission spectra in laboratories.
Absorption Spectrum


An absorption spectrum occurs when atoms absorb certain wavelengths from a continuous spectrum.
Characteristics:
- Appears as dark lines within a continuous spectrum
- These dark lines correspond to wavelengths absorbed by atoms
A famous example is the Fraunhofer lines observed in the solar spectrum.
These lines occur because gases in the Sun’s atmosphere absorb specific wavelengths.
Origin of Spectral Lines
Spectral lines arise due to transitions between electron energy levels.
When an electron moves from a higher energy level (E_2) to a lower level (E_1), energy is emitted as a photon.
[
E = E_2 – E_1
]
The wavelength of the emitted radiation is:
[
\lambda = \frac{hc}{E_2 – E_1}
]
This explains why each element produces specific wavelengths.
Hydrogen Atomic Spectrum


The hydrogen atom produces several spectral series corresponding to different electron transitions.
These series are explained by the Bohr model.
Lyman Series
Transitions where electrons fall to (n = 1).
Characteristics:
- Occur in the ultraviolet region
- High energy transitions
Balmer Series
Transitions where electrons fall to (n = 2).
Characteristics:
- Occur in the visible region
- Responsible for visible hydrogen spectral lines
The Balmer formula was discovered by Johann Balmer.
Paschen Series
Transitions ending at (n = 3).
These spectral lines lie in the infrared region.
Brackett Series
Transitions ending at (n = 4).
These occur in the infrared region.
Pfund Series
Transitions ending at (n = 5).
These are also infrared spectral lines.
Rydberg Formula
The wavelengths of hydrogen spectral lines can be calculated using the formula developed by Johannes Rydberg.
[
\frac{1}{\lambda} = R \left(\frac{1}{n_1^2} – \frac{1}{n_2^2}\right)
]
Where:
- (R) = Rydberg constant
- (n_1) and (n_2) are integers
This formula accurately predicts hydrogen spectral wavelengths.
Spectroscopy
The study of atomic spectra is called spectroscopy.
Spectroscopy involves analyzing light emitted or absorbed by substances.
A spectroscope or spectrometer is used to separate light into its component wavelengths.
Spectroscopy provides information about:
- Chemical composition
- Temperature
- Density
- Motion of objects
Quantum Explanation of Atomic Spectra
The quantum mechanical model provides a deeper explanation of atomic spectra.
Electrons exist in orbitals described by wave functions obtained from the Schrödinger equation.
Energy levels in atoms are quantized, meaning electrons can occupy only certain allowed states.
Transitions between these states produce spectral lines.
Selection Rules
Not all transitions between energy levels are allowed.
Selection rules determine which transitions are permitted.
One common rule is:
[
\Delta l = \pm 1
]
These rules arise from conservation of angular momentum.
Fine Structure of Spectral Lines
Fine structure refers to the small splitting of spectral lines.
This occurs due to:
- Relativistic corrections
- Electron spin interactions
These effects cause closely spaced spectral lines.
Zeeman Effect
The Zeeman effect occurs when spectral lines split in the presence of a magnetic field.
Pieter Zeeman discovered this phenomenon.
The splitting occurs because magnetic fields interact with electron magnetic moments.
This effect is used to study magnetic fields in stars and laboratory plasmas.
Stark Effect
The Stark effect occurs when spectral lines split due to an external electric field.
It was discovered by Johannes Stark.
The Stark effect is important in plasma diagnostics and spectroscopy.
Applications of Atomic Spectra
Atomic spectra have numerous applications in science and technology.
Astronomy
Spectroscopy allows astronomers to determine the composition of stars and galaxies.
By studying spectral lines, scientists can identify elements present in distant celestial bodies.
Chemical Analysis
Spectral analysis helps identify unknown substances.
Each element produces unique spectral lines.
Environmental Monitoring
Spectroscopy is used to detect pollutants in air and water.
Medical Diagnostics
Spectroscopy techniques are used in medical imaging and laboratory diagnostics.
Plasma Physics
Spectral lines help determine the temperature and density of plasma.
Importance of Atomic Spectra
The study of atomic spectra led to major discoveries in physics.
It helped establish:
- Quantum theory
- Atomic structure
- Energy quantization
- Electron transitions
Spectroscopy continues to be an essential tool in modern science.
Historical Significance
Atomic spectra played a major role in the development of quantum mechanics.
Early spectral observations showed that atoms emit radiation at specific wavelengths.
This contradicted classical physics and required new theories.
The work of scientists such as:
- Niels Bohr
- Max Planck
- Albert Einstein
helped establish the quantum framework needed to explain spectral phenomena.
Modern Spectroscopic Techniques
Modern spectroscopy uses advanced instruments such as:
- Laser spectroscopy
- Mass spectroscopy
- Infrared spectroscopy
- Raman spectroscopy
These techniques provide highly precise measurements of atomic and molecular spectra.
Conclusion
Atomic spectra represent one of the most important discoveries in modern physics. The study of spectral lines revealed that atoms possess discrete energy levels and that energy exchanges occur in quantized units. This discovery led to the development of quantum mechanics and greatly improved our understanding of atomic structure.
Each element produces a unique spectral signature, allowing scientists to identify substances even at great distances, such as in stars and galaxies. Spectroscopy has become a powerful tool across many scientific disciplines, including astronomy, chemistry, environmental science, and medicine.
Today, atomic spectra continue to play a vital role in scientific research, providing insights into the fundamental structure of matter and the interactions between light and atoms.