
Statistics in Mathematics – Detailed Explanation with Examples
1. Introduction to Statistics


Statistics is a branch of mathematics that deals with the collection, organization, analysis, interpretation, and presentation of data. It helps researchers and decision-makers understand patterns, relationships, and trends within data. Statistics is essential in many fields such as science, economics, business, medicine, engineering, and social sciences.
In simple terms, statistics helps answer questions like:
- What does the data show?
- What patterns exist in the data?
- What conclusions can be drawn from the data?
Statistics is used to transform raw data into meaningful information. Governments, companies, scientists, and educators use statistics to make informed decisions.
For example:
- Governments analyze population data.
- Businesses study customer behavior.
- Doctors analyze medical data.
- Scientists test research hypotheses.
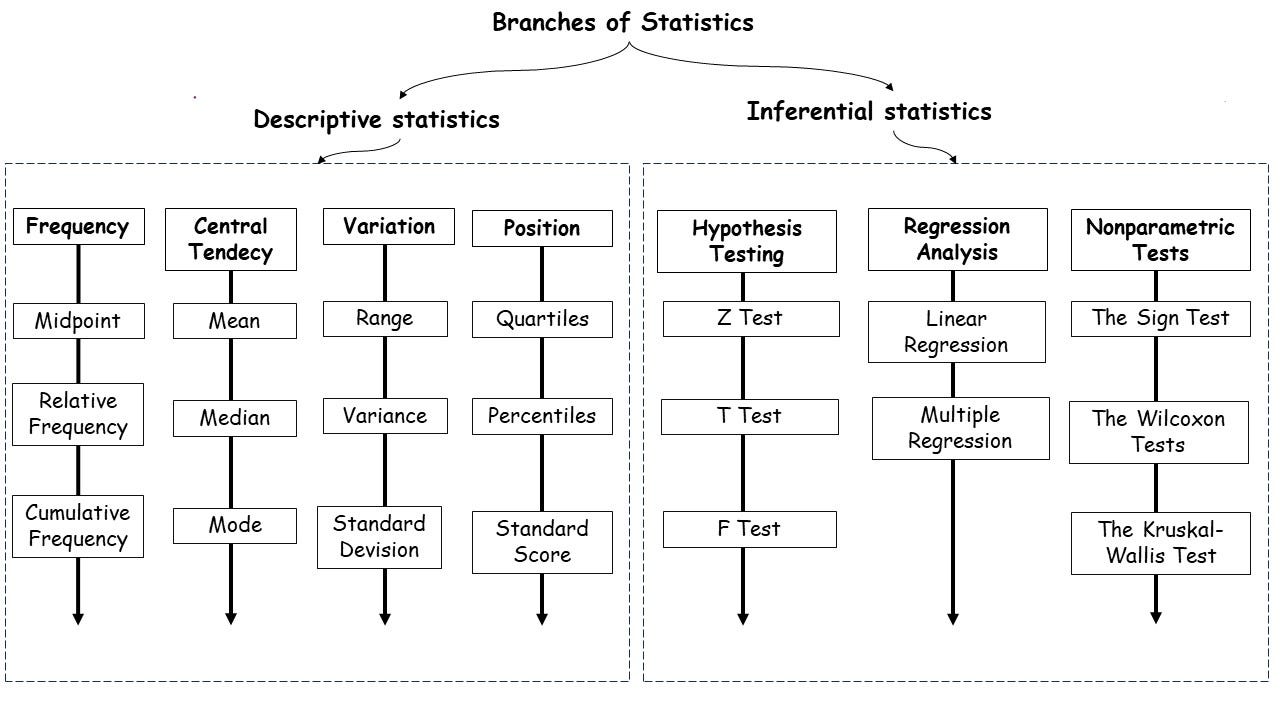
Statistics is often divided into two main branches:
- Descriptive Statistics
- Inferential Statistics
Both branches play important roles in analyzing and interpreting data.
2. Types of Statistics


Statistics can be broadly classified into two categories.
Descriptive Statistics
Descriptive statistics deals with summarizing and organizing data so it can be easily understood.
It includes methods such as:
- Tables
- Graphs
- Averages
- Percentages
Descriptive statistics does not make predictions. Instead, it simply describes the data that has been collected.
Example:
A teacher calculates the average marks of students in a class.
This gives a summary of the class performance.
Inferential Statistics
Inferential statistics involves drawing conclusions or making predictions about a population based on sample data.
It uses probability and statistical methods to estimate values and test hypotheses.
Example:
A survey of 100 people is used to estimate the opinions of an entire city.
Inferential statistics allows researchers to make conclusions even when it is not possible to study the entire population.
3. Basic Statistical Terms


Understanding statistics requires knowledge of several important terms.
Population
A population refers to the entire group of individuals or objects that a researcher wants to study.
Example:
All students in a school.
Sample
A sample is a smaller subset taken from the population.
Example:
50 students selected from the school.
Studying samples is easier and less expensive than studying entire populations.
Data
Data refers to the information collected for analysis.
Data can be numbers, measurements, observations, or responses.
Example:
- Heights of students
- Exam scores
- Survey responses
Variables
A variable is a characteristic that can change or vary.
Examples include:
- Age
- Height
- Weight
- Income
Variables are generally classified into two types:
Qualitative Variables
These describe categories.
Examples:
- Gender
- Color
- Nationality
Quantitative Variables
These represent numerical values.
Examples:
- Height
- Temperature
- Salary
4. Data Collection Methods
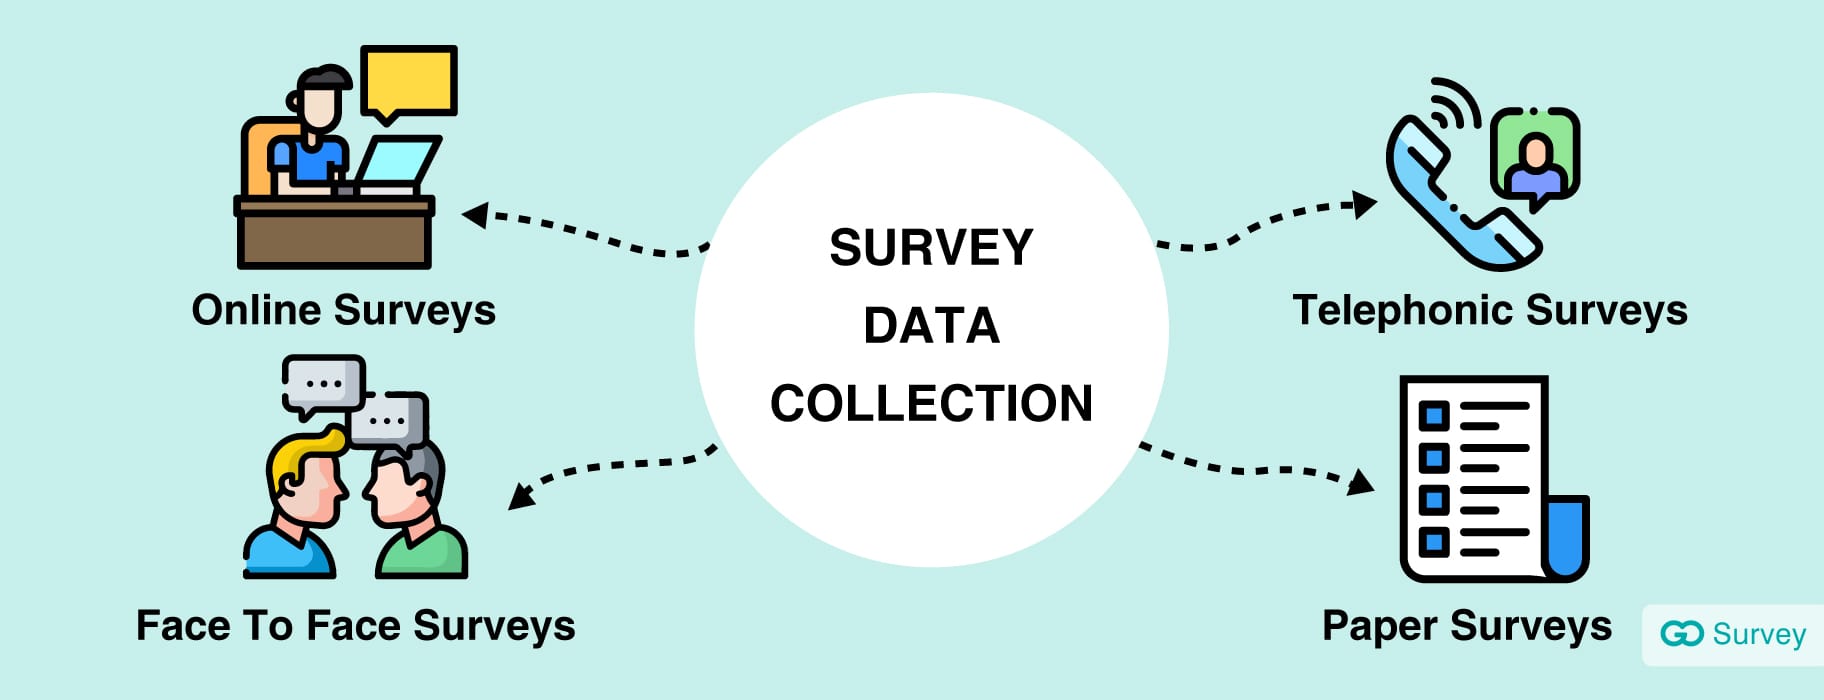
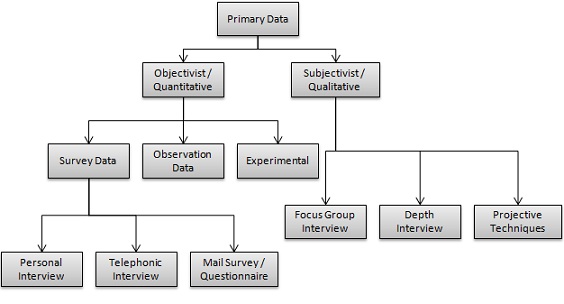


Data collection is the first step in statistical analysis.
Common methods include:
Surveys
Surveys collect information by asking questions.
Example:
Customer satisfaction surveys.
Experiments
Experiments involve controlled testing.
Example:
Testing a new medicine on patients.
Observation
Data is collected by watching events or behaviors.
Example:
Studying animal behavior.
Sampling Methods
Sampling methods determine how samples are selected.
Common sampling methods include:
- Random sampling
- Systematic sampling
- Stratified sampling
- Cluster sampling
Proper sampling ensures that results accurately represent the population.
5. Organizing Data
After collecting data, it must be organized so that it can be analyzed effectively.
Methods of organizing data include:
Frequency Tables
A frequency table shows how often each value occurs.
Example:
| Marks | Frequency |
|---|---|
| 40–50 | 3 |
| 50–60 | 5 |
| 60–70 | 10 |
Cumulative Frequency
This shows the total frequency up to a certain value.
Data Grouping
Large datasets are often grouped into classes or intervals.
Grouping simplifies data analysis.
6. Graphical Representation of Data


Graphs and charts help visualize data.
Bar Graph
Used to compare different categories.
Example:
Comparing sales of products.
Pie Chart
Shows proportions or percentages.
Example:
Distribution of household expenses.
Histogram
Represents frequency distribution of continuous data.
Line Graph
Shows trends over time.
Example:
Population growth.
Graphical representations make complex data easier to understand.
7. Measures of Central Tendency


Measures of central tendency describe the center or typical value of a dataset.
The three main measures are:
Mean (Average)
The mean is calculated by adding all values and dividing by the number of values.
Example:
Data: 5, 7, 8
[
Mean=\frac{5+7+8}{3}=6.67
]
Median
The median is the middle value when data is arranged in order.
Example:
Data: 2, 4, 6, 8, 10
Median = 6
Mode
The mode is the most frequently occurring value.
Example:
Data: 3, 5, 5, 7
Mode = 5
These measures summarize large datasets using a single representative value.
8. Measures of Dispersion


Measures of dispersion describe how spread out data values are.
Range
Range is the difference between the largest and smallest values.
Example:
Data: 5, 10, 15
Range = 15 − 5 = 10
Variance
Variance measures how far values are from the mean.
Standard Deviation
Standard deviation is the square root of variance.
It measures the average distance from the mean.
Small standard deviation indicates that data points are close to the mean.
Large standard deviation indicates more variation.
9. Probability and Statistics


Probability plays an important role in statistics.
Probability measures the likelihood of an event occurring.
The probability of an event is:
[
P(E)=\frac{\text{Number of favorable outcomes}}{\text{Total outcomes}}
]
Example:
Probability of getting heads when flipping a coin:
[
P=\frac{1}{2}
]
Probability helps statisticians make predictions and analyze uncertainty.
10. Probability Distributions


A probability distribution describes how probabilities are distributed across possible outcomes.
Normal Distribution
Also called the bell curve.
Characteristics:
- Symmetrical shape
- Mean = Median = Mode
Many natural phenomena follow normal distribution.
Binomial Distribution
Used when there are only two possible outcomes.
Example:
Success or failure.
Poisson Distribution
Used for counting events occurring within a fixed interval.
Example:
Number of phone calls received per hour.
11. Hypothesis Testing
Hypothesis testing is used to determine whether a claim about a population is true.
Steps in hypothesis testing:
- State the hypothesis
- Collect data
- Analyze data
- Draw conclusions
There are two hypotheses:
Null Hypothesis
Assumes no effect or difference.
Alternative Hypothesis
Suggests there is an effect or difference.
Statistical tests help determine whether to accept or reject the hypothesis.
12. Applications of Statistics


Statistics has numerous real-world applications.
Business
Companies use statistics to analyze sales, customer behavior, and market trends.
Medicine
Doctors use statistics to test medicines and analyze medical data.
Economics
Economists analyze inflation, unemployment, and economic growth using statistical data.
Sports
Statistics evaluate player performance and team strategies.
Government
Governments analyze population, employment, and education statistics.
Statistics helps organizations make informed decisions based on data.
13. Importance of Statistics
Statistics is important because it allows us to:
- Understand large datasets
- Identify trends and patterns
- Make predictions
- Support decision-making
- Conduct scientific research
In today’s data-driven world, statistics plays a crucial role in solving real-world problems.
14. Conclusion
Statistics is a powerful branch of mathematics that focuses on collecting, organizing, analyzing, and interpreting data. It provides tools for understanding complex information and making informed decisions. Through methods such as descriptive statistics, probability, and inferential analysis, statistics helps researchers uncover patterns and relationships within data.
From scientific research to business planning and public policy, statistics is widely used to analyze information and guide decision-making. As data continues to grow in importance in modern society, the role of statistics becomes increasingly significant in shaping knowledge and innovation.