

📘 1. Introduction to SQL
SQL (Structured Query Language) is a standard programming language used to store, manipulate, and retrieve data from relational databases. It is the backbone of modern data-driven applications and is widely used in industries such as finance, healthcare, e-commerce, education, and more.
SQL was developed in the 1970s at IBM by Donald D. Chamberlin and Raymond F. Boyce. Initially called SEQUEL (Structured English Query Language), it evolved into SQL and became an international standard (ANSI/ISO).
🔹 Why SQL is Important
- Enables efficient data management
- Used in web applications, mobile apps, enterprise systems
- Supports data analysis and reporting
- Works with major database systems like:
- MySQL
- PostgreSQL
- Oracle Database
- SQL Server
- SQLite
🔹 Characteristics of SQL
- Declarative language (focus on what to do, not how)
- Supports complex queries
- Standardized (ANSI SQL)
- Integrates with multiple programming languages
- Supports transactions and concurrency
🧱 2. Relational Database Fundamentals

SQL works with Relational Database Management Systems (RDBMS).
🔹 Core Concepts
1. Table
A table is a collection of related data organized in rows and columns.
2. Row (Record)
Represents a single entry.
3. Column (Field)
Represents an attribute of the data.
4. Primary Key
- Unique identifier for each record
- Cannot be NULL
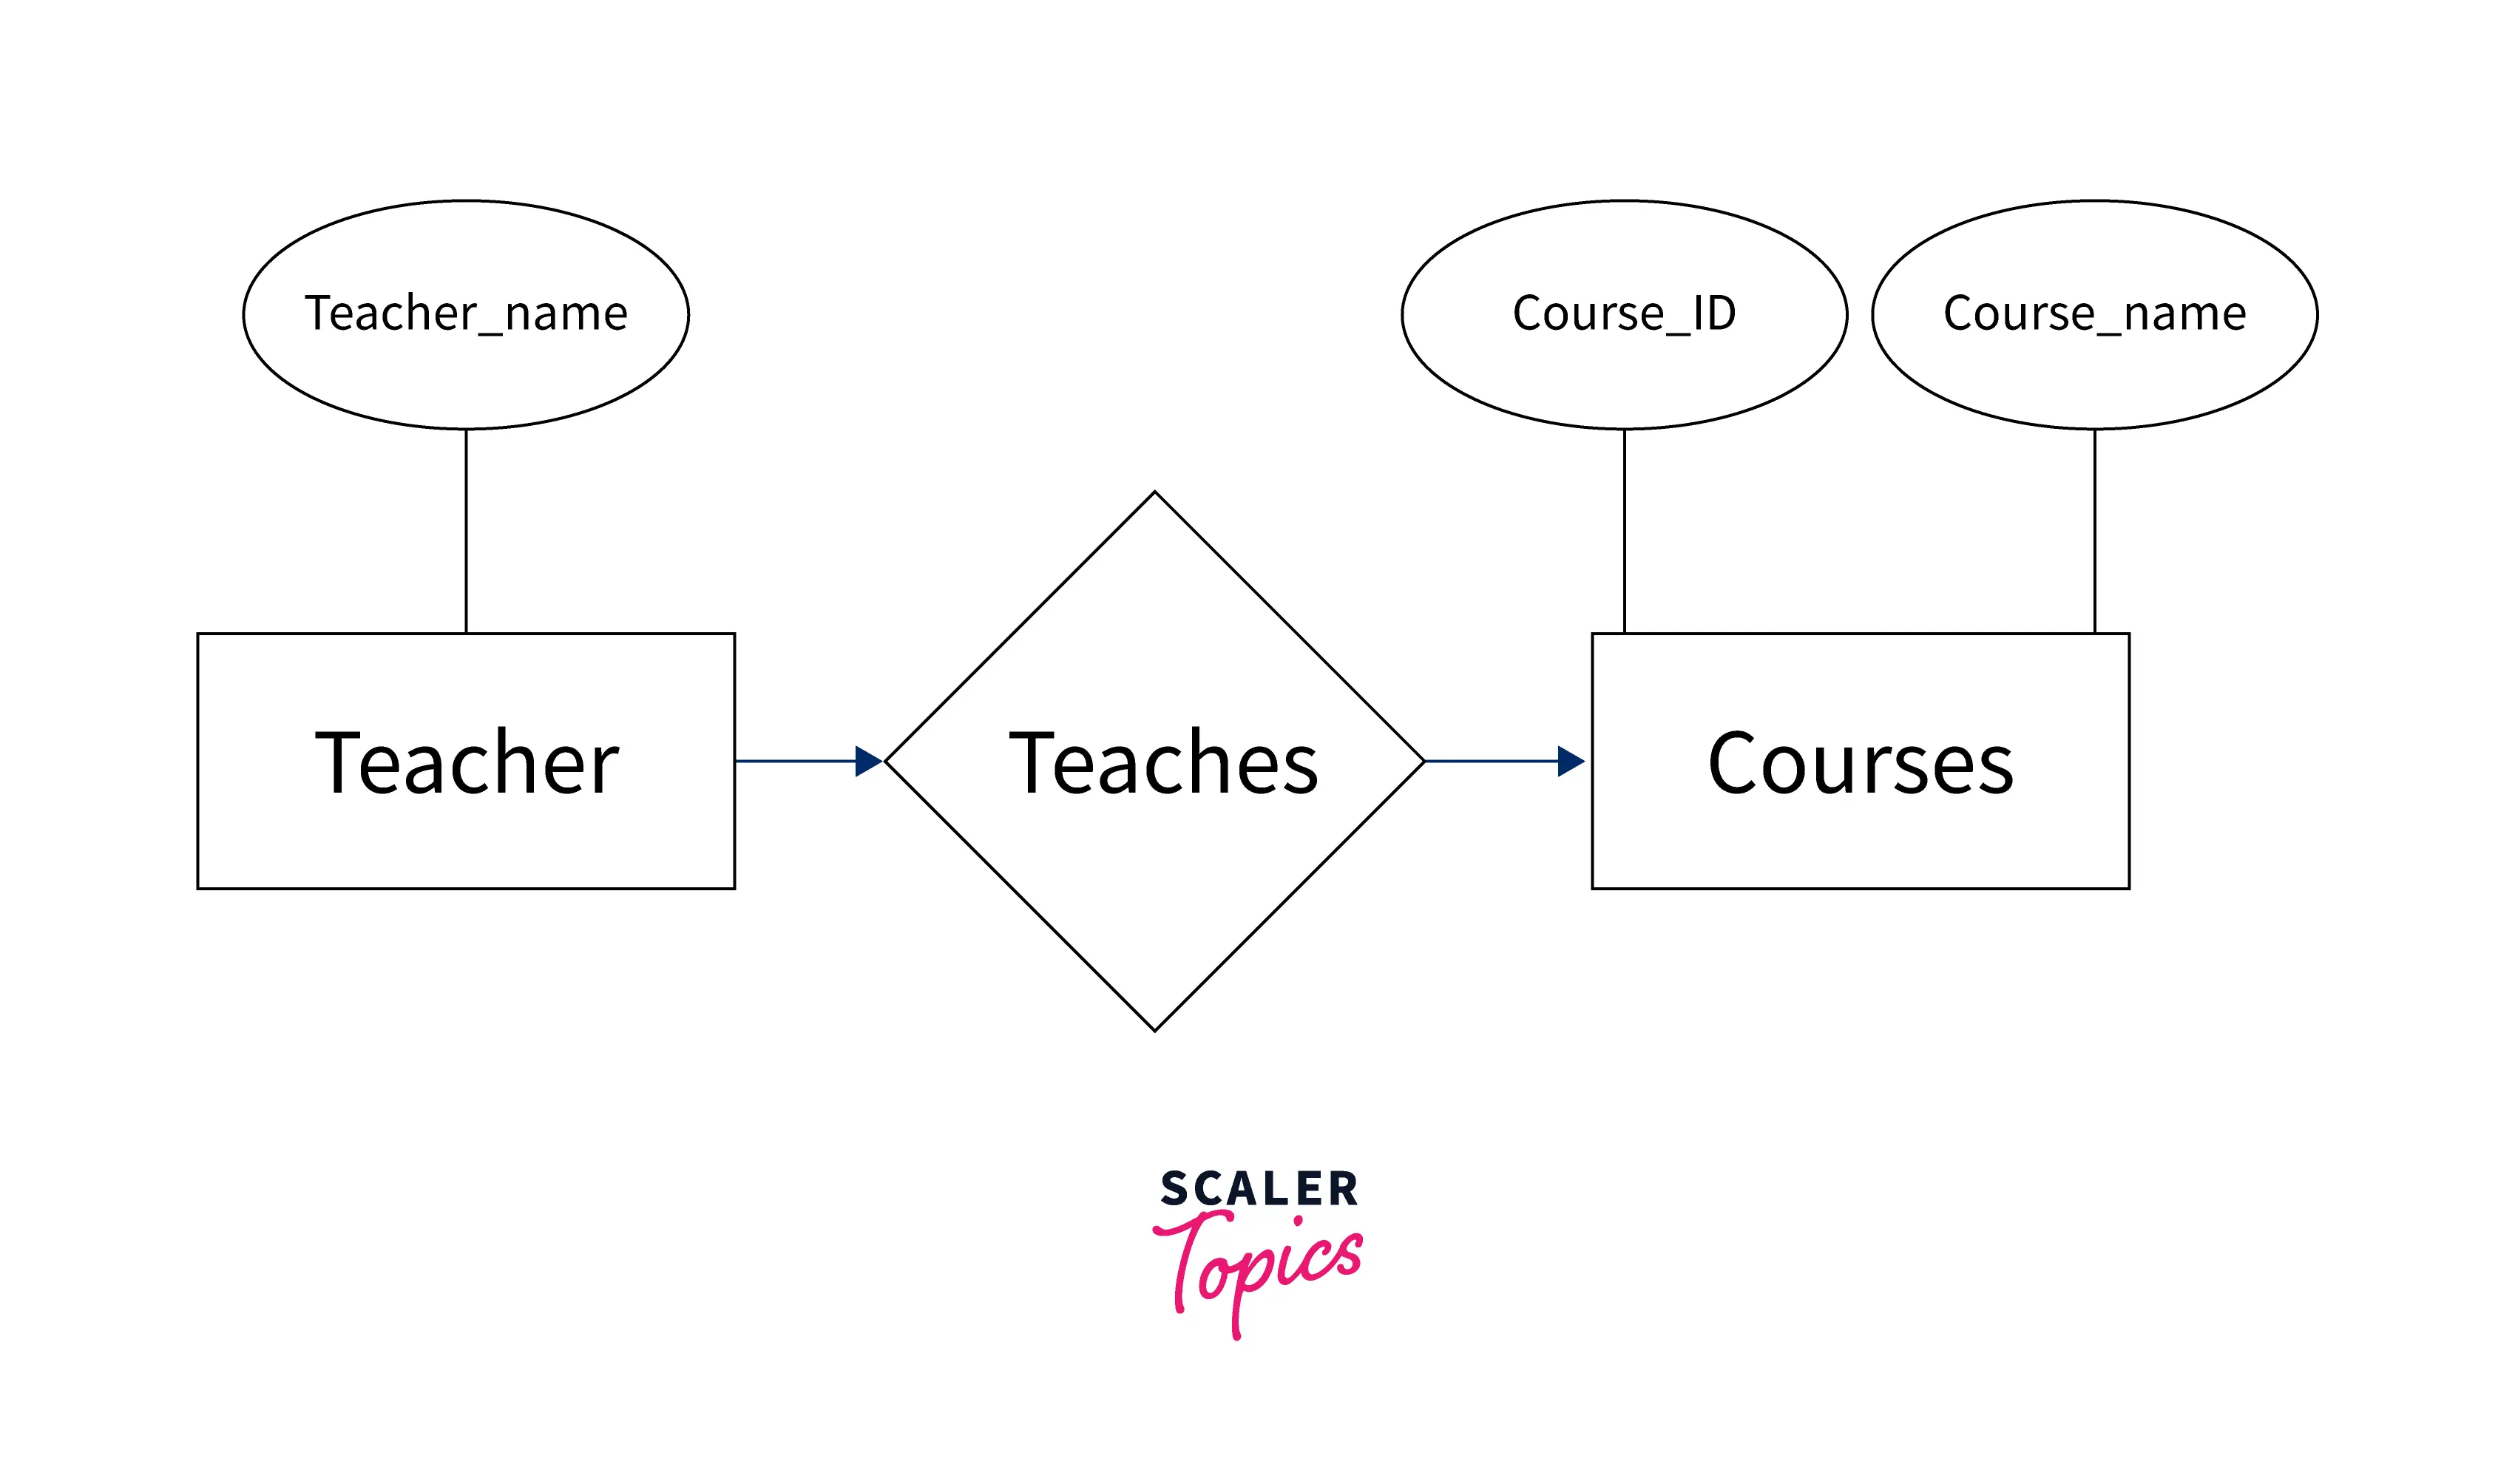
5. Foreign Key
- Links two tables together
- Maintains referential integrity
6. Schema
- Structure of the database
🔹 Example Table
| ID | Name | Age |
|---|---|---|
| 1 | John | 25 |
| 2 | Sara | 30 |
🧮 3. Types of SQL Commands
SQL commands are divided into categories:
🔹 1. DDL (Data Definition Language)
Used to define database structure.
CREATEALTERDROPTRUNCATE
Example:
CREATE TABLE Students (
    ID INT PRIMARY KEY,
    Name VARCHAR(50),
    Age INT
);
🔹 2. DML (Data Manipulation Language)
Used to manipulate data.
INSERTUPDATEDELETE
INSERT INTO Students VALUES (1, 'John', 25);

UPDATE Students SET Age = 26 WHERE ID = 1;

DELETE FROM Students WHERE ID = 1;
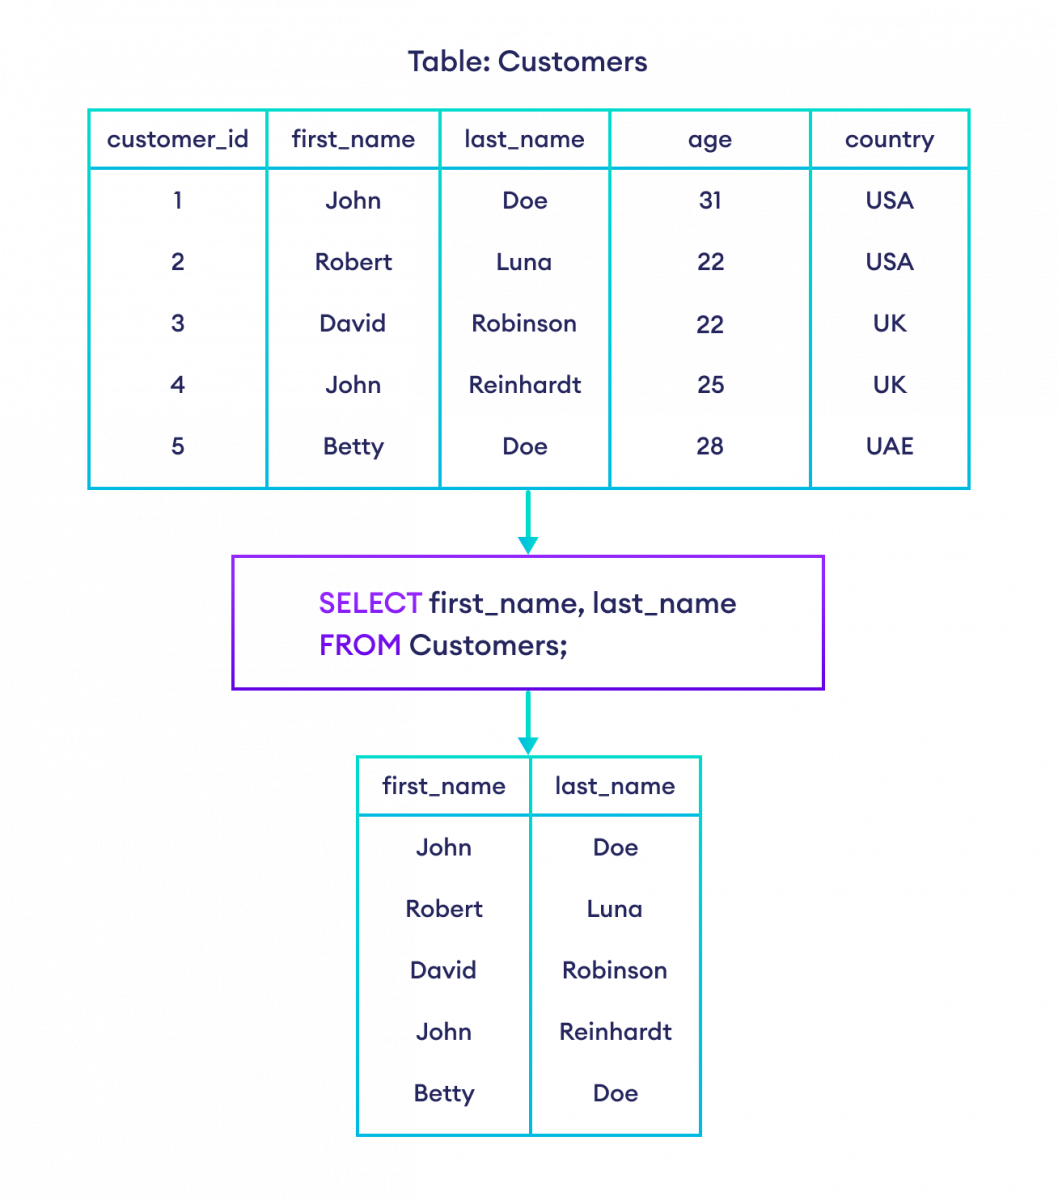
🔹 3. DQL (Data Query Language)
SELECT
SELECT * FROM Students;
🔹 4. DCL (Data Control Language)
GRANTREVOKE
🔹 5. TCL (Transaction Control Language)
COMMITROLLBACKSAVEPOINT
🔍 4. SQL Queries and Clauses

🔹 SELECT Statement
SELECT column1, column2 FROM table_name;
🔹 WHERE Clause
SELECT * FROM Students WHERE Age > 25;
🔹 ORDER BY
SELECT * FROM Students ORDER BY Age DESC;
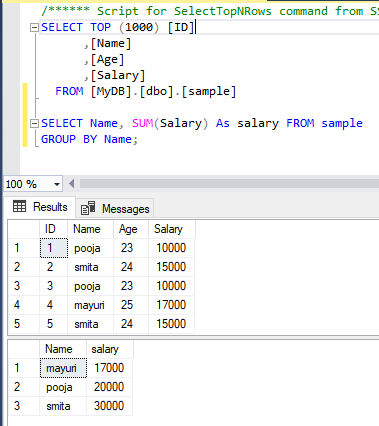
🔹 GROUP BY
SELECT Age, COUNT(*) FROM Students GROUP BY Age;
🔹 HAVING
SELECT Age, COUNT(*)
FROM Students
GROUP BY Age
HAVING COUNT(*) > 1;
🔹 DISTINCT
SELECT DISTINCT Age FROM Students;
🔗 5. SQL Joins

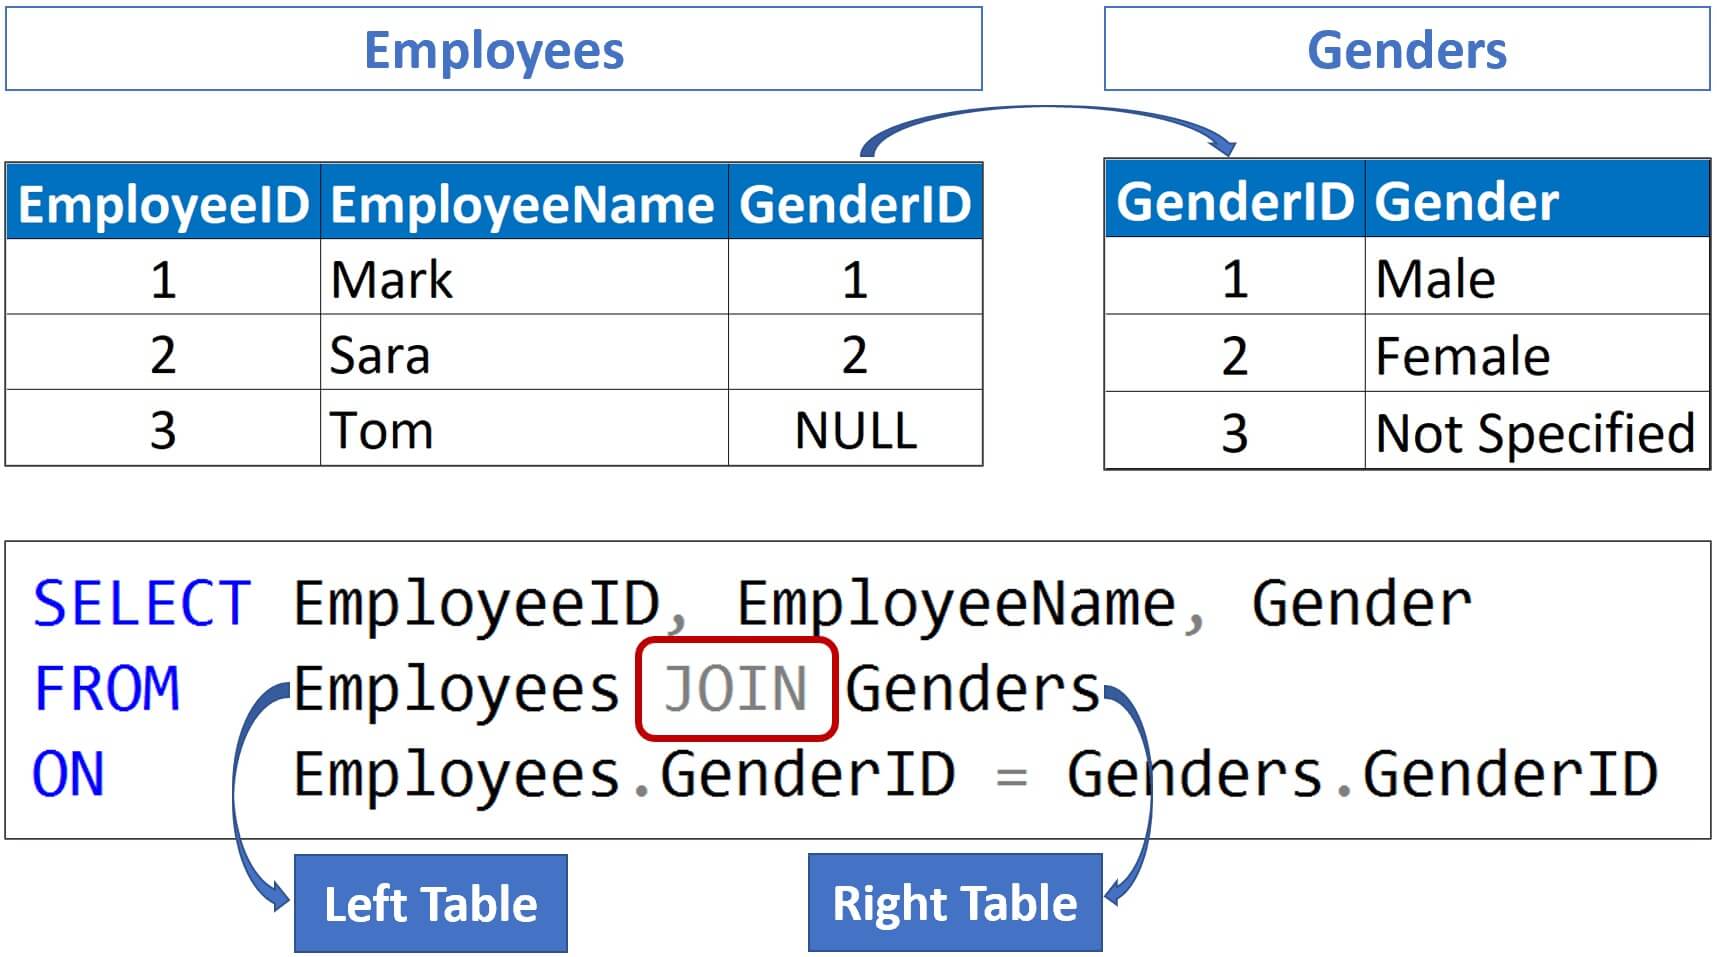
Joins combine rows from multiple tables.
🔹 Types of Joins
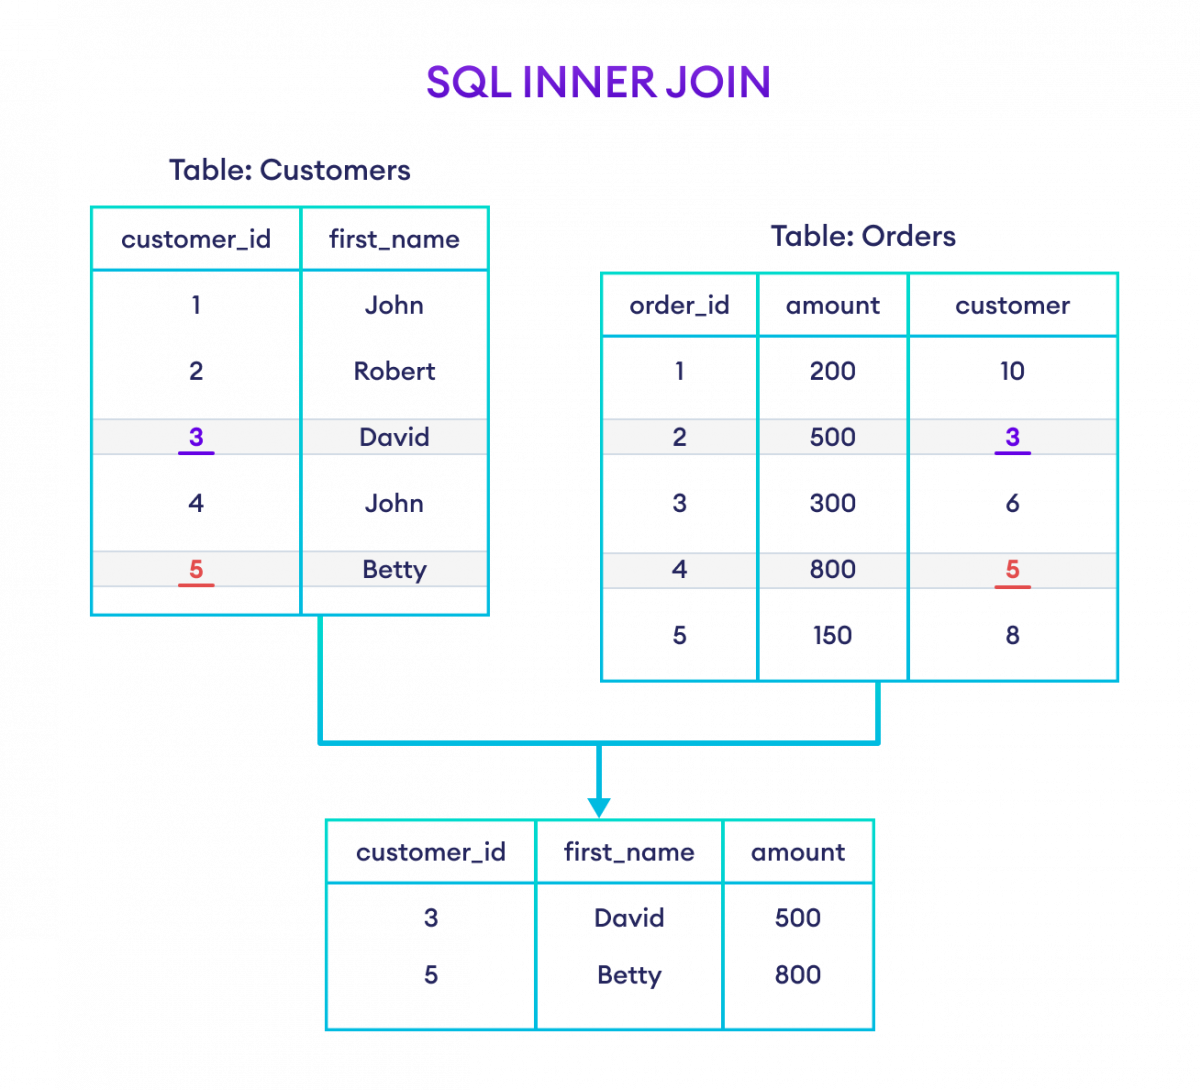
1. INNER JOIN
Returns matching rows.
SELECT * FROM A INNER JOIN B ON A.id = B.id;
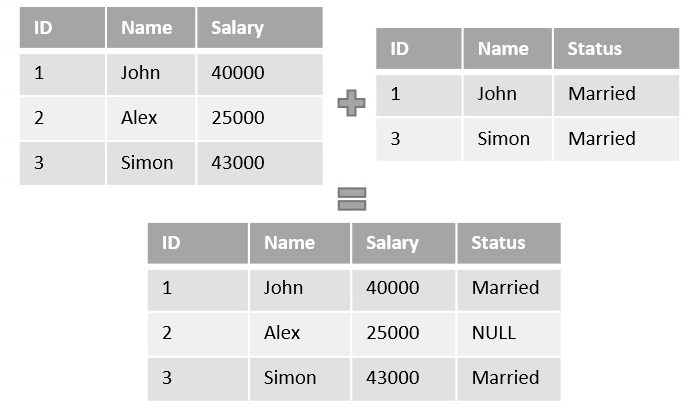
2. LEFT JOIN
Returns all rows from left table.
3. RIGHT JOIN
Returns all rows from right table.
4. FULL JOIN
Returns all rows from both tables.
🧠 6. SQL Functions
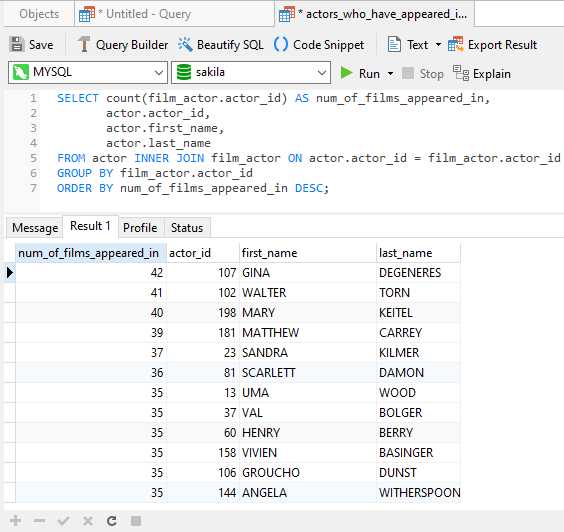
🔹 Aggregate Functions
COUNT()SUM()AVG()MIN()MAX()
SELECT AVG(Age) FROM Students;
🔹 String Functions
UPPER()LOWER()LENGTH()
🔹 Date Functions
NOW()CURDATE()
🏗️ 7. Constraints in SQL
Constraints enforce rules on data.
- NOT NULL
- UNIQUE
- PRIMARY KEY
- FOREIGN KEY
- CHECK
- DEFAULT
CREATE TABLE Users (
    ID INT PRIMARY KEY,
    Email VARCHAR(100) UNIQUE
);
🔄 8. Normalization
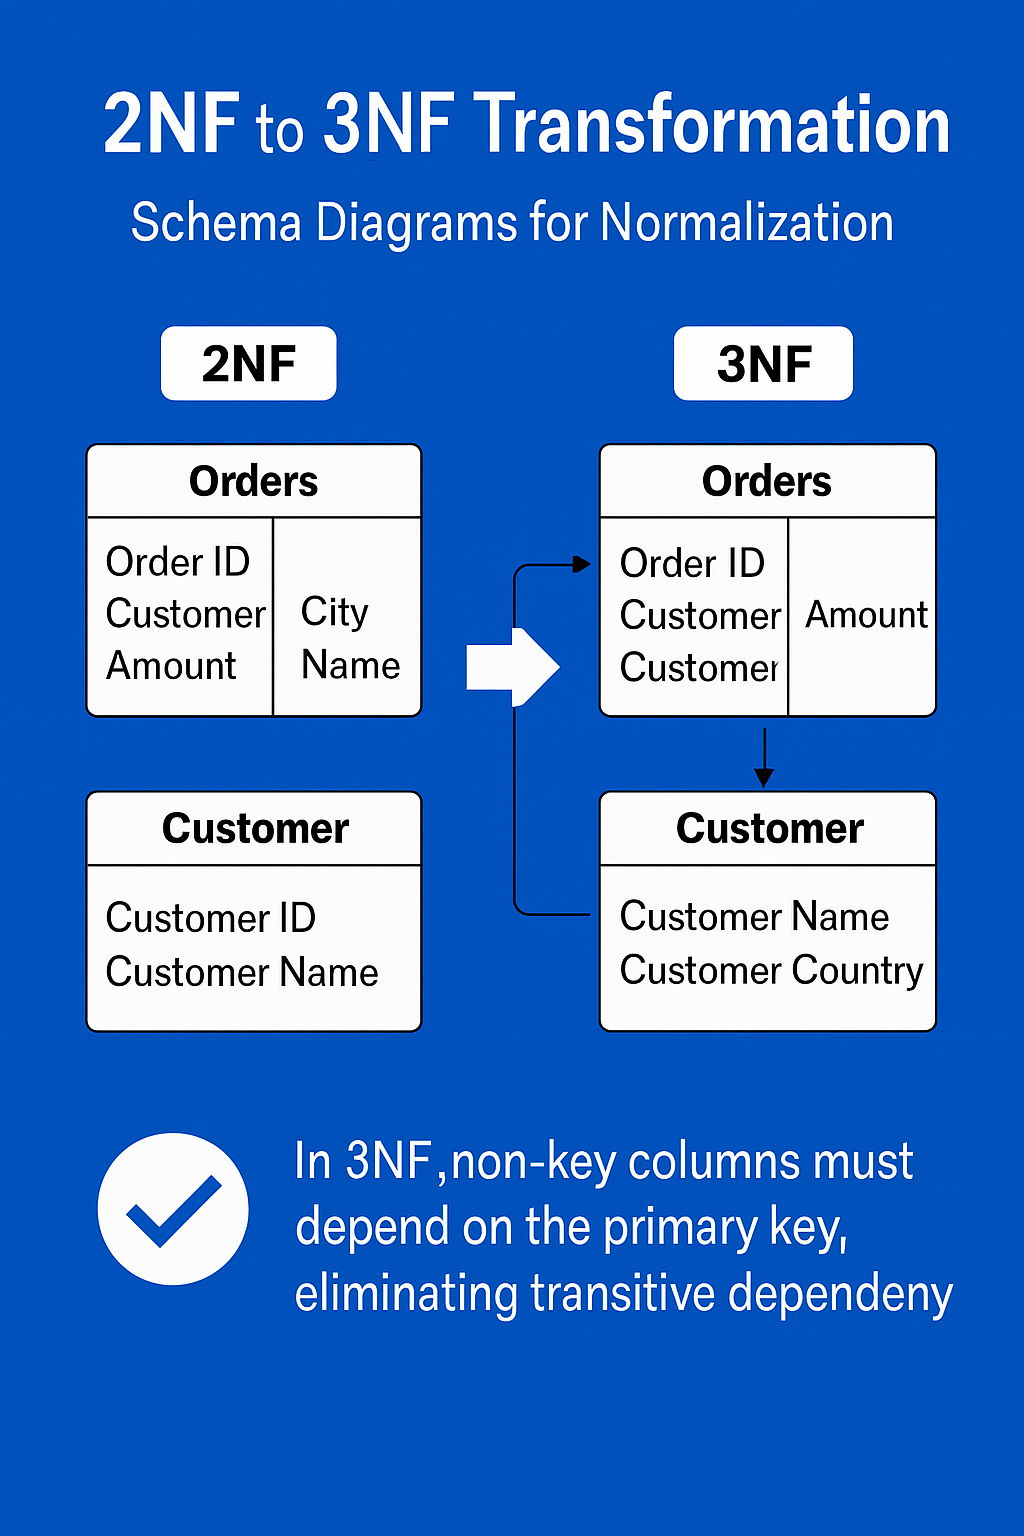
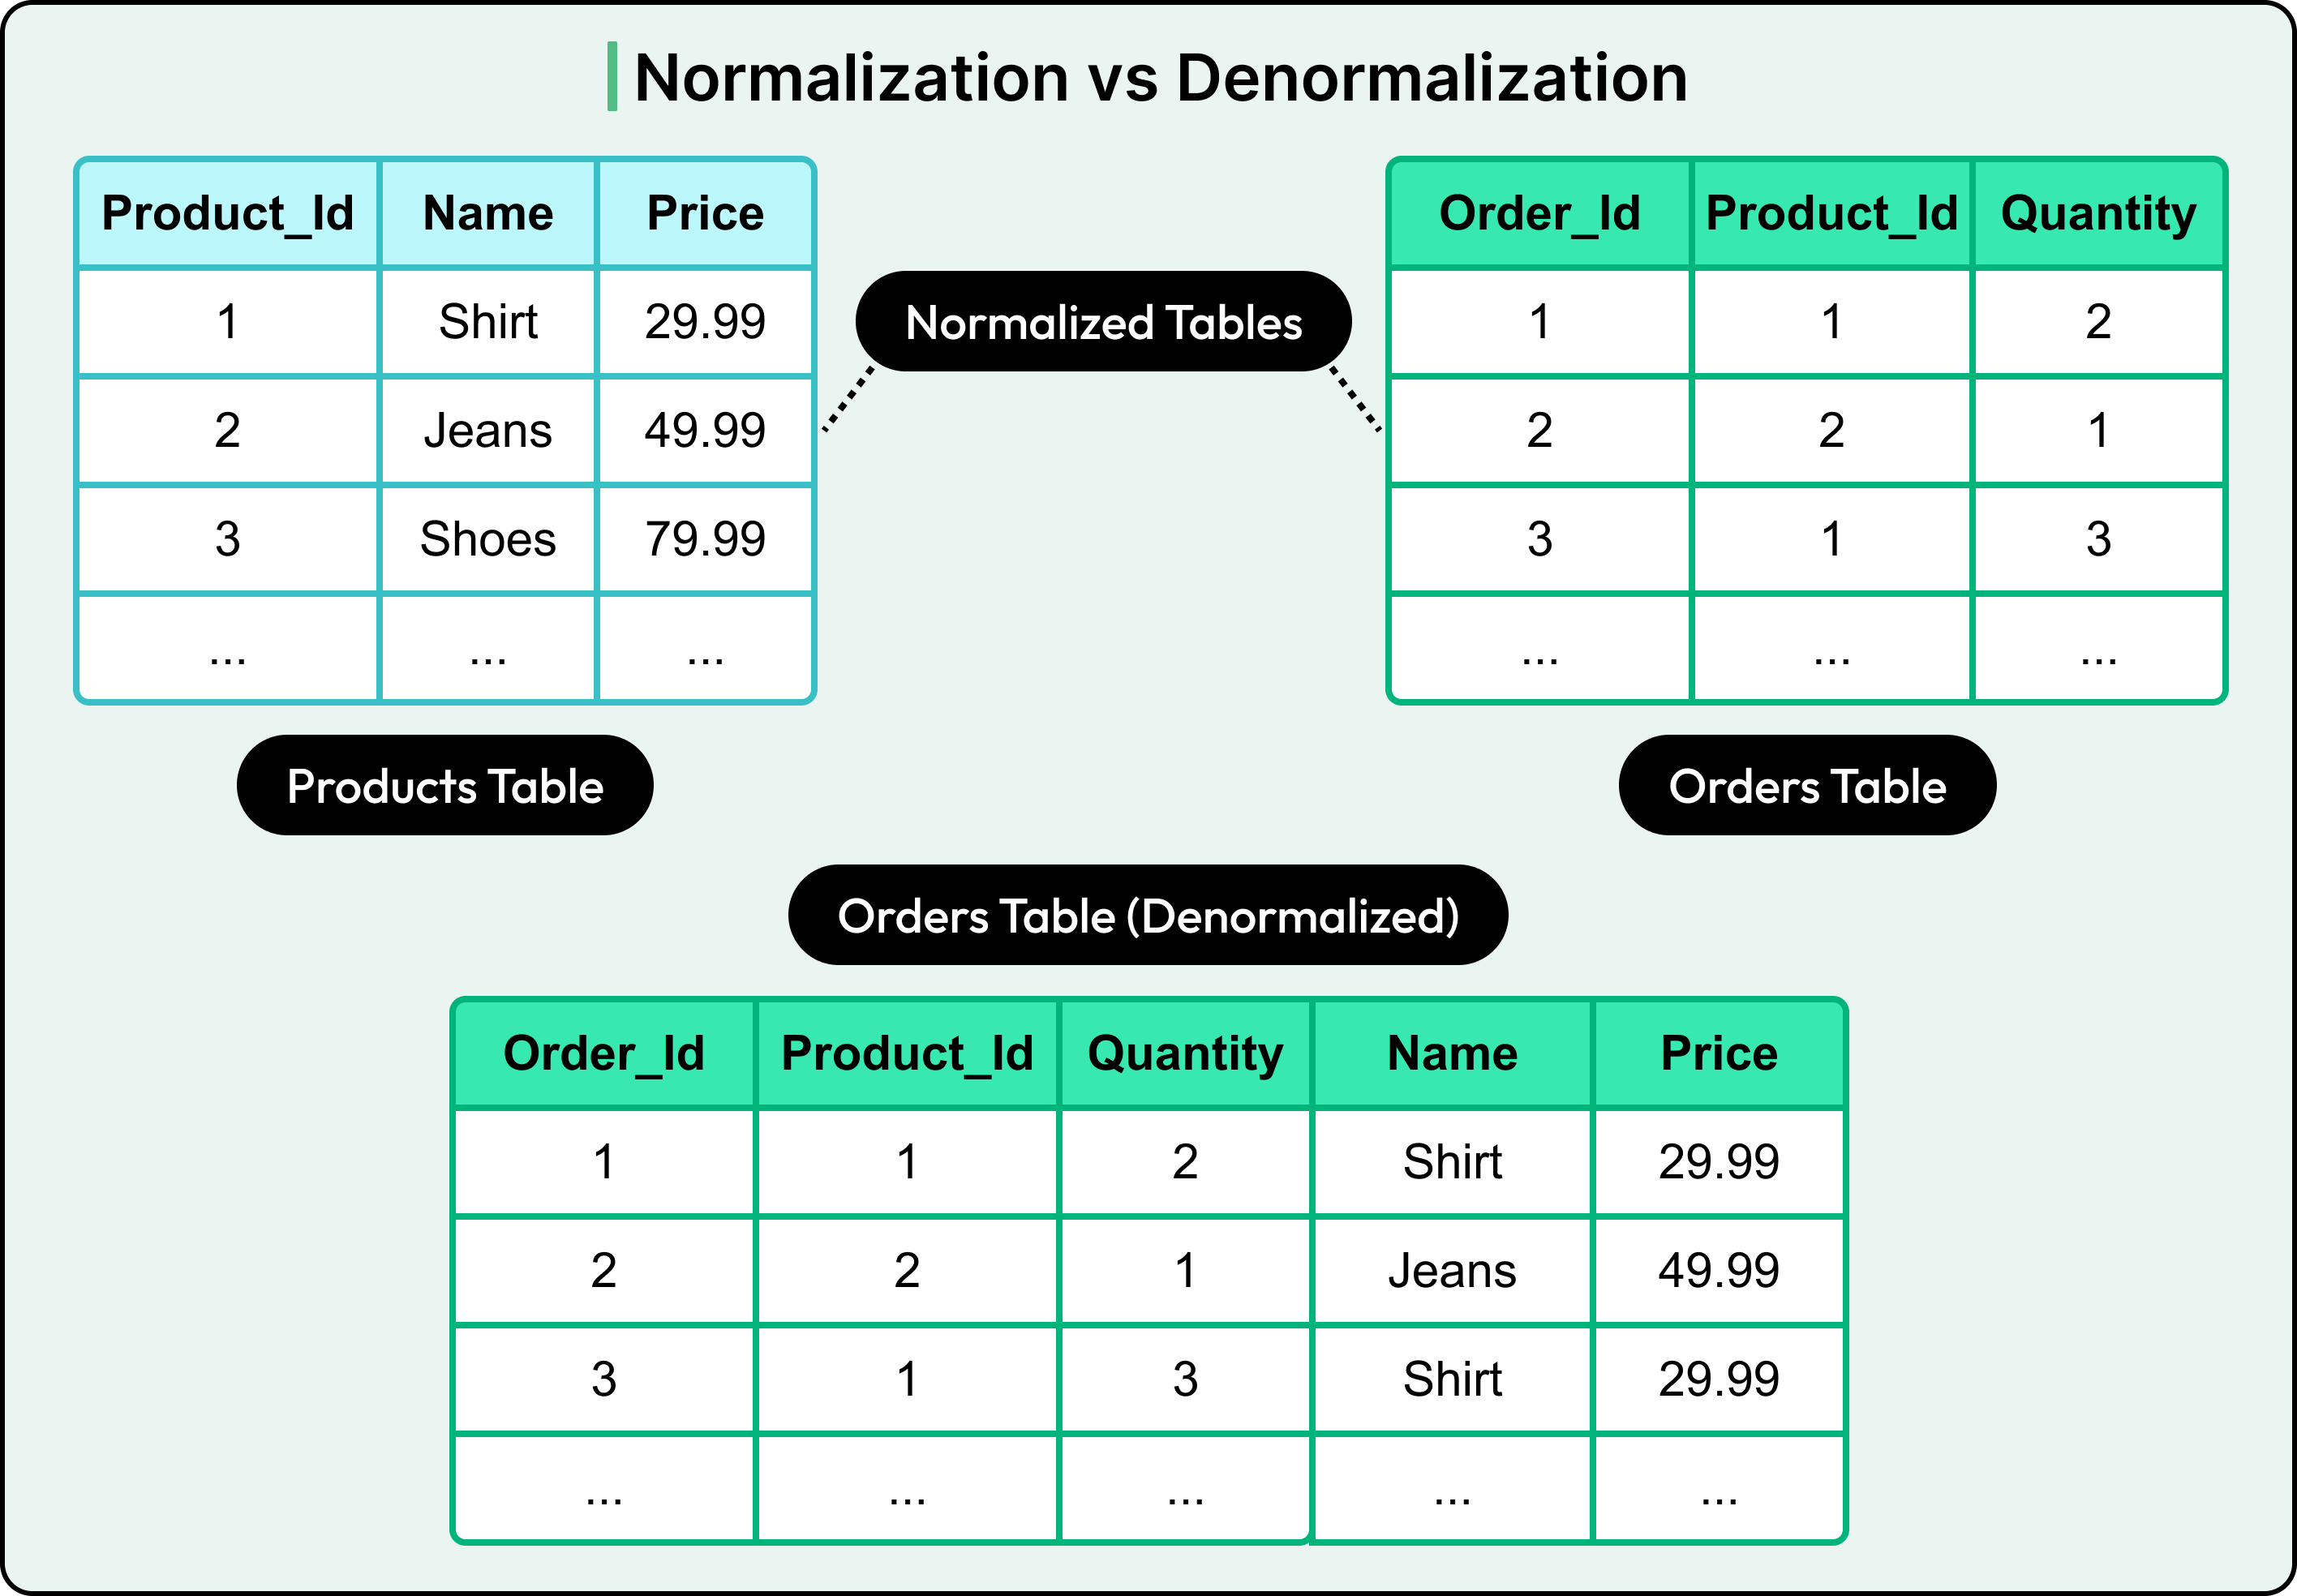

Normalization reduces redundancy.
🔹 Types:
- 1NF: Atomic values
- 2NF: Remove partial dependency
- 3NF: Remove transitive dependency
⚡ 9. Indexing
Indexes improve query performance.
CREATE INDEX idx_name ON Students(Name);
Types:
- Single-column index
- Composite index
- Unique index
🔐 10. Transactions
A transaction is a unit of work.
Properties (ACID):
- Atomicity
- Consistency
- Isolation
- Durability
🔁 11. Subqueries
SELECT Name FROM Students
WHERE Age > (SELECT AVG(Age) FROM Students);
📊 12. Views
Virtual tables based on queries.
CREATE VIEW StudentView AS
SELECT Name FROM Students;
🧩 13. Stored Procedures
Reusable SQL code.
CREATE PROCEDURE GetStudents()
BEGIN
    SELECT * FROM Students;
END;
🔔 14. Triggers
Automatically executed events.
CREATE TRIGGER before_insert
BEFORE INSERT ON Students
FOR EACH ROW
SET NEW.Name = UPPER(NEW.Name);
🌐 15. SQL vs NoSQL
| Feature | SQL | NoSQL |
|---|---|---|
| Structure | Table-based | Flexible |
| Schema | Fixed | Dynamic |
| Scalability | Vertical | Horizontal |
🧪 16. Advanced SQL Concepts
- Window Functions (
ROW_NUMBER(),RANK()) - CTE (Common Table Expressions)
- Recursive Queries
- Partitioning
- Query Optimization
📈 17. SQL Performance Optimization
- Use indexes
- Avoid SELECT *
- Optimize joins
- Use caching
- Analyze execution plans
🧰 18. Popular SQL Databases
- MySQL
- PostgreSQL
- Oracle
- SQL Server
- SQLite
🧑💻 19. Real-World Applications
- Banking systems
- E-commerce platforms
- Social media
- Data analytics
- Inventory systems
📚 20. Advantages of SQL
- Easy to learn
- Powerful querying
- High performance
- Standardized
⚠️ 21. Limitations of SQL
- Not ideal for unstructured data
- Scaling challenges
- Complex queries can be slow
🔮 22. Future of SQL
- Integration with AI & Big Data
- Cloud databases (AWS, Azure, GCP)
- Real-time analytics
- Hybrid SQL/NoSQL systems
🏁 Conclusion
SQL remains one of the most essential tools in computing. Whether you are a developer, data analyst, or engineer, mastering SQL enables you to handle data efficiently, build scalable systems, and extract meaningful insights.