


Introduction to Variance and Standard Deviation
In statistics and mathematics, understanding the center of a dataset is important, but it is equally important to understand how the data values are spread around that center. Measures such as mean, median, and mode describe the central tendency of a dataset, while variance and standard deviation describe the dispersion or variability of the data.
Variance and standard deviation measure how much individual data values differ from the mean of the dataset. They help statisticians understand whether the data values are close to the average or widely spread out.
For example, consider two classes of students that both have the same average score of 70. In the first class, most students scored between 68 and 72, while in the second class, scores ranged from 40 to 100. Although the averages are the same, the variability in the second class is much greater. Variance and standard deviation help quantify this difference.
Variance and standard deviation are widely used in many fields including mathematics, economics, finance, engineering, social sciences, machine learning, and data science. They provide insight into the stability, consistency, and reliability of data.
These measures are fundamental components of statistical analysis and are essential for understanding probability distributions, hypothesis testing, and data modeling.
Concept of Dispersion


Before understanding variance and standard deviation, it is important to understand the concept of dispersion.
Dispersion refers to how much the values in a dataset vary or spread out around the central value.
If the values are close to the mean, the dispersion is low. If the values are far from the mean, the dispersion is high.
Several statistical measures describe dispersion:
- Range
- Quartile deviation
- Mean deviation
- Variance
- Standard deviation
Among these measures, variance and standard deviation are the most widely used because they provide precise mathematical descriptions of variability.
Dispersion is important because it helps determine the reliability of the average value. Two datasets with the same mean may behave very differently depending on how spread out the data is.
Variance


Definition of Variance
Variance is a statistical measure that describes the average of the squared differences between each data point and the mean of the dataset.
It shows how far the data values are spread from the mean.
Mathematically, the variance of a dataset is calculated using the formula:
σ² = Σ (x − μ)² / N
Where:
- σ² represents variance
- x represents each data value
- μ represents the mean
- N represents the number of observations
For a sample dataset, the variance formula is:
s² = Σ (x − x̄)² / (n − 1)
Where:
- s² = sample variance
- x̄ = sample mean
- n = number of observations
Variance measures the average squared deviation from the mean.
Example of Variance
Consider the dataset:
4, 6, 8, 10, 12
Step 1: Find the mean.
Mean = (4 + 6 + 8 + 10 + 12) / 5 = 8
Step 2: Find deviations from the mean.
4 − 8 = −4
6 − 8 = −2
8 − 8 = 0
10 − 8 = 2
12 − 8 = 4
Step 3: Square each deviation.
16, 4, 0, 4, 16
Step 4: Find the average.
Variance = (16 + 4 + 0 + 4 + 16) / 5 = 8
Thus, the variance is 8.
Variance gives an idea of how much the values vary from the mean.
Standard Deviation


Definition of Standard Deviation
Standard deviation is the square root of variance. It measures the average distance of data points from the mean.
Mathematically:
σ = √(σ²)
Where:
- σ represents standard deviation
- σ² represents variance
Standard deviation is easier to interpret than variance because it is expressed in the same units as the original data.
Example of Standard Deviation
Using the previous example:
Variance = 8
Standard deviation:
σ = √8 ≈ 2.83
Thus, the standard deviation is approximately 2.83.
This means the typical distance between the data values and the mean is about 2.83 units.
Population vs Sample Standard Deviation


In statistics, we distinguish between population and sample measurements.
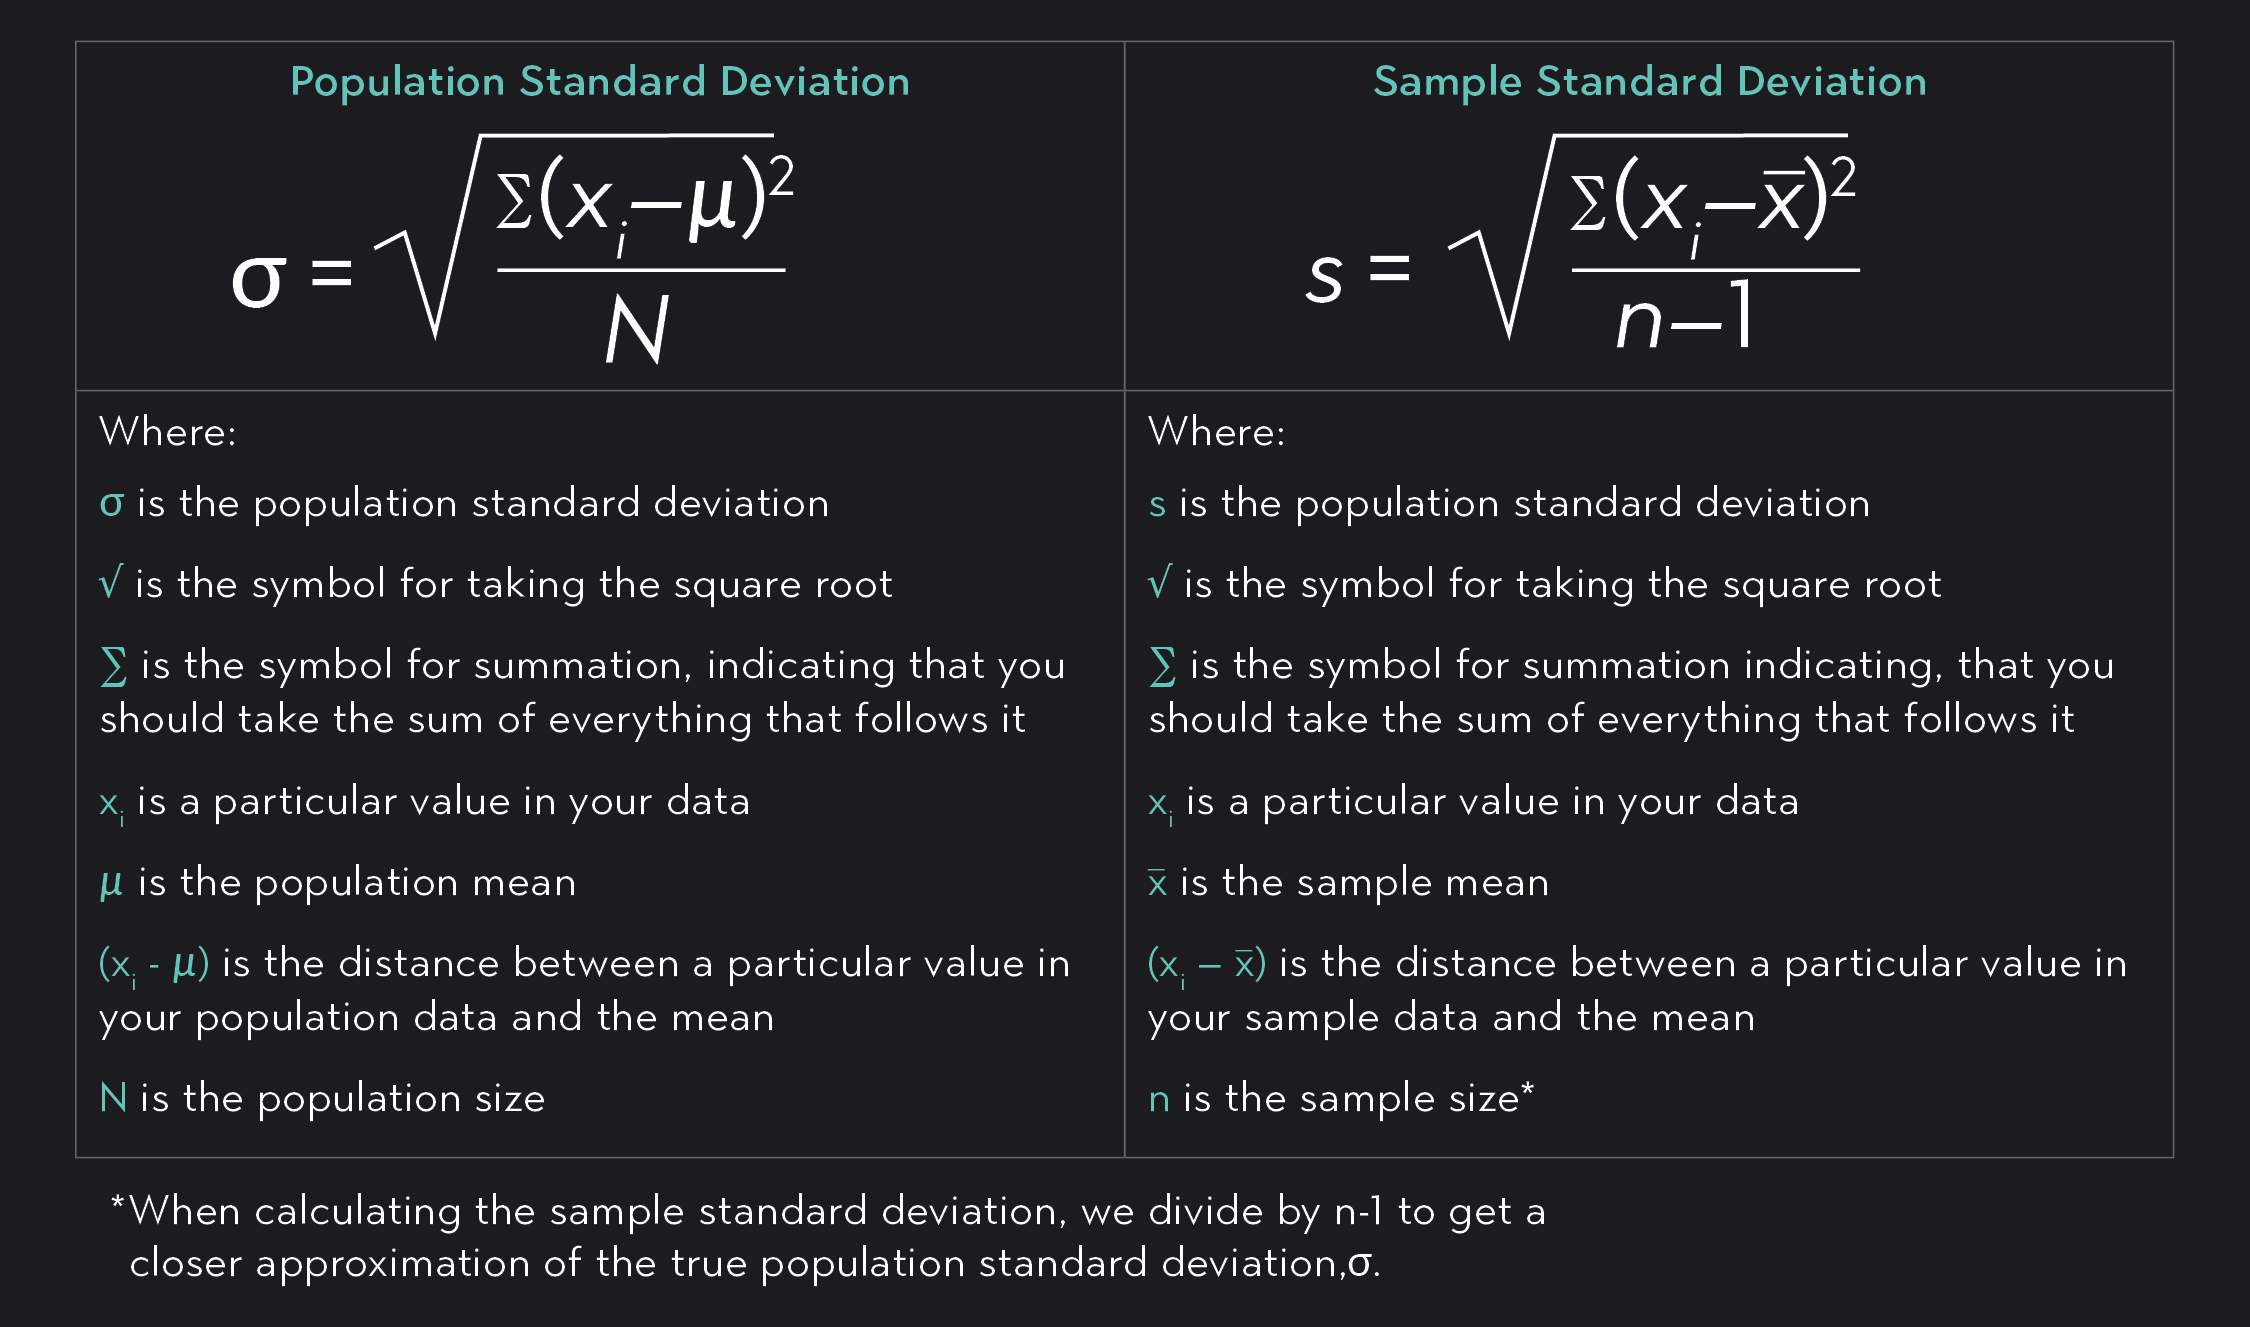
Population Standard Deviation
Used when the entire population is studied.
Formula:
σ = √(Σ(x − μ)² / N)
Sample Standard Deviation
Used when analyzing a sample from the population.
Formula:
s = √(Σ(x − x̄)² / (n − 1))
The denominator (n − 1) is called Bessel’s correction, which improves the accuracy of sample estimates.
Interpretation of Standard Deviation


Standard deviation helps interpret how data is distributed around the mean.
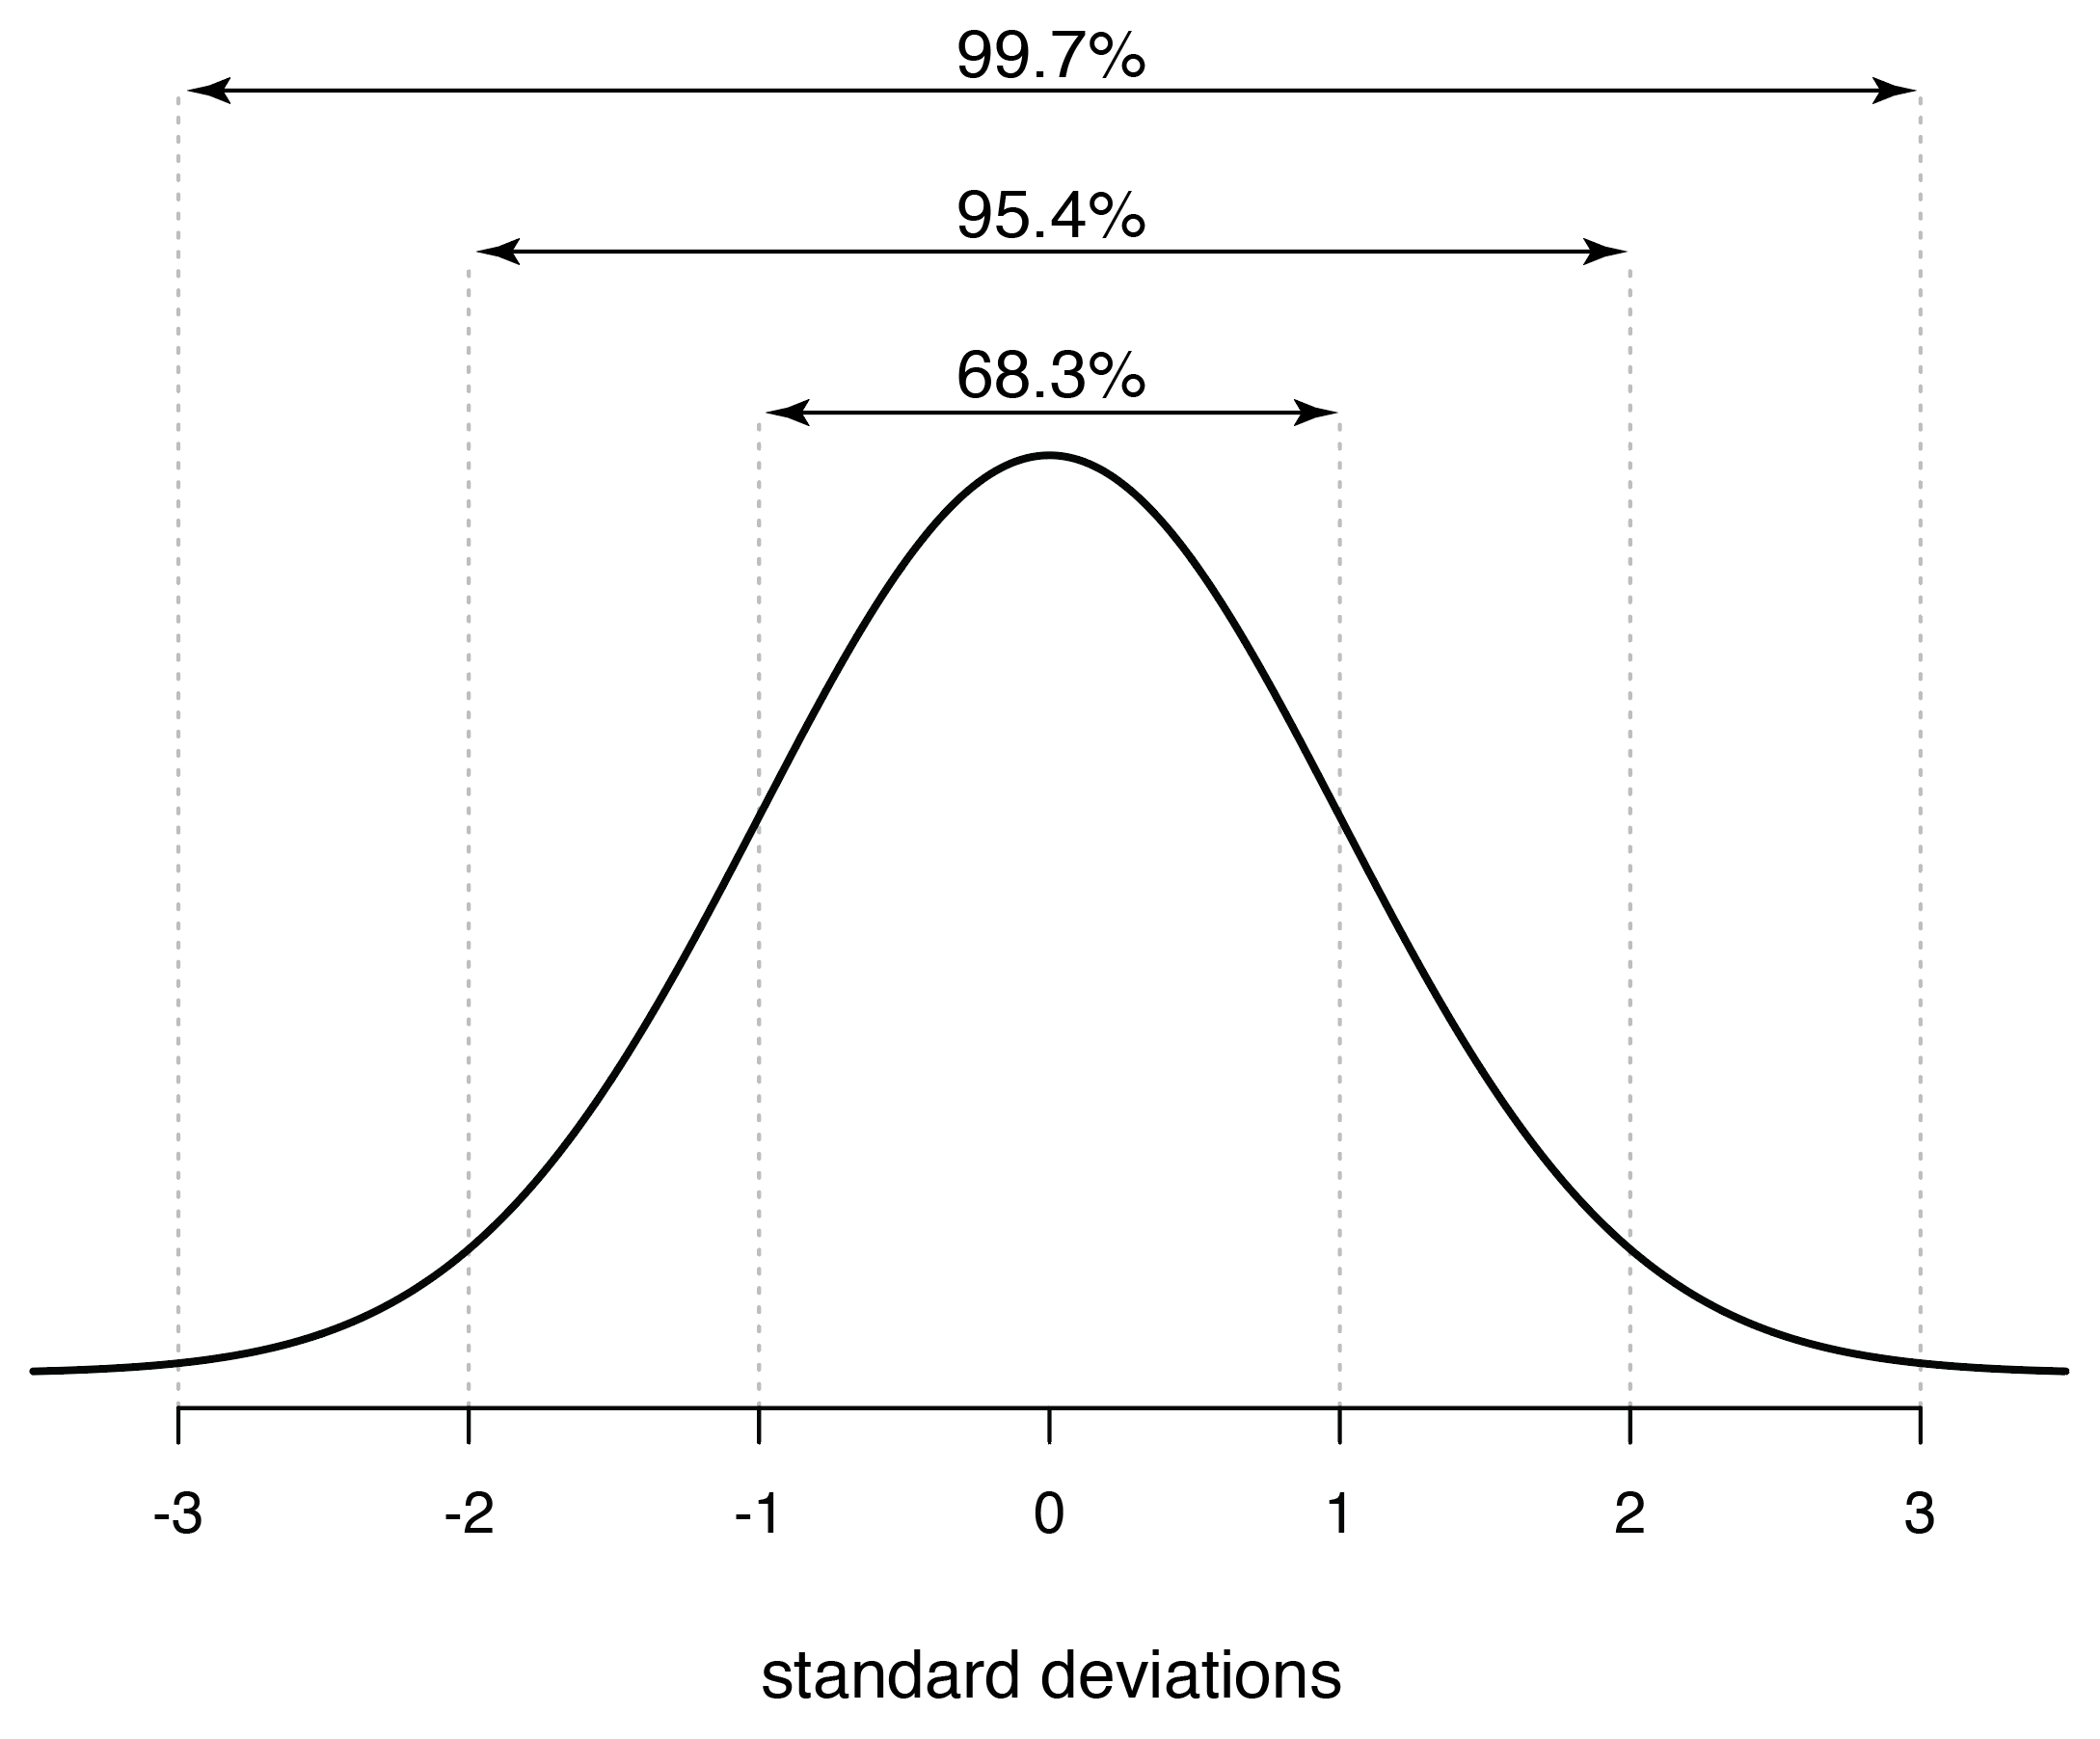
In a normal distribution, the empirical rule applies:
- 68% of data lies within 1 standard deviation of the mean.
- 95% of data lies within 2 standard deviations.
- 99.7% of data lies within 3 standard deviations.
This rule helps understand probability distributions.
A small standard deviation indicates that the data values are close to the mean, while a large standard deviation indicates that the data values are widely spread.
Properties of Variance and Standard Deviation
Variance and standard deviation have several important properties.
Non-Negative
Both variance and standard deviation are always greater than or equal to zero.
Dependence on Units
Variance uses squared units, while standard deviation uses the same units as the data.
Sensitivity to Outliers
Extreme values significantly affect variance and standard deviation.
Relationship with Mean
Both measures depend on the mean of the dataset.
These properties help statisticians understand how dispersion behaves in different datasets.
Applications of Variance and Standard Deviation


Variance and standard deviation are used in many real-world applications.
Finance
Investors use standard deviation to measure risk and volatility in financial markets.
Quality Control
Manufacturers analyze variability in production processes.
Data Science
Machine learning algorithms use variance to measure feature importance.
Scientific Research
Researchers analyze variability in experimental results.
Education
Standard deviation is used to measure the spread of exam scores.
These applications demonstrate the importance of understanding data variability.
Advantages of Variance and Standard Deviation
Variance and standard deviation provide several benefits.
- They measure data variability precisely.
- They use all observations in the dataset.
- They are widely applicable in statistical analysis.
- They form the basis of many advanced statistical methods.
These measures are essential tools in modern statistics.
Limitations of Variance and Standard Deviation
Despite their usefulness, these measures have some limitations.
- They are affected by extreme values.
- Variance is difficult to interpret because of squared units.
- They assume numerical data and cannot be used for categorical variables.
Despite these limitations, they remain essential tools in statistical analysis.
Importance in Statistical Analysis
Variance and standard deviation are fundamental in many statistical methods.
They are used in:
- probability distributions
- hypothesis testing
- regression analysis
- statistical modeling
- machine learning algorithms
Without these measures, it would be difficult to analyze variability and uncertainty in data.
Conclusion
Variance and standard deviation are essential measures of dispersion in statistics that describe how data values spread around the mean. Variance measures the average squared deviation from the mean, while standard deviation represents the square root of variance and indicates the typical distance of data points from the mean.
These measures provide valuable insights into the variability and consistency of datasets. They are widely used in fields such as finance, engineering, economics, science, and data analysis.
Understanding variance and standard deviation helps researchers and analysts interpret data more effectively and draw meaningful conclusions from statistical studies. They form a crucial part of statistical analysis and are fundamental tools for studying data variability.