Tag Archives: mathematics statistics article

Regression and Correlation in Statistics

Image
Image
Image
Image

Introduction to Regression and Correlation

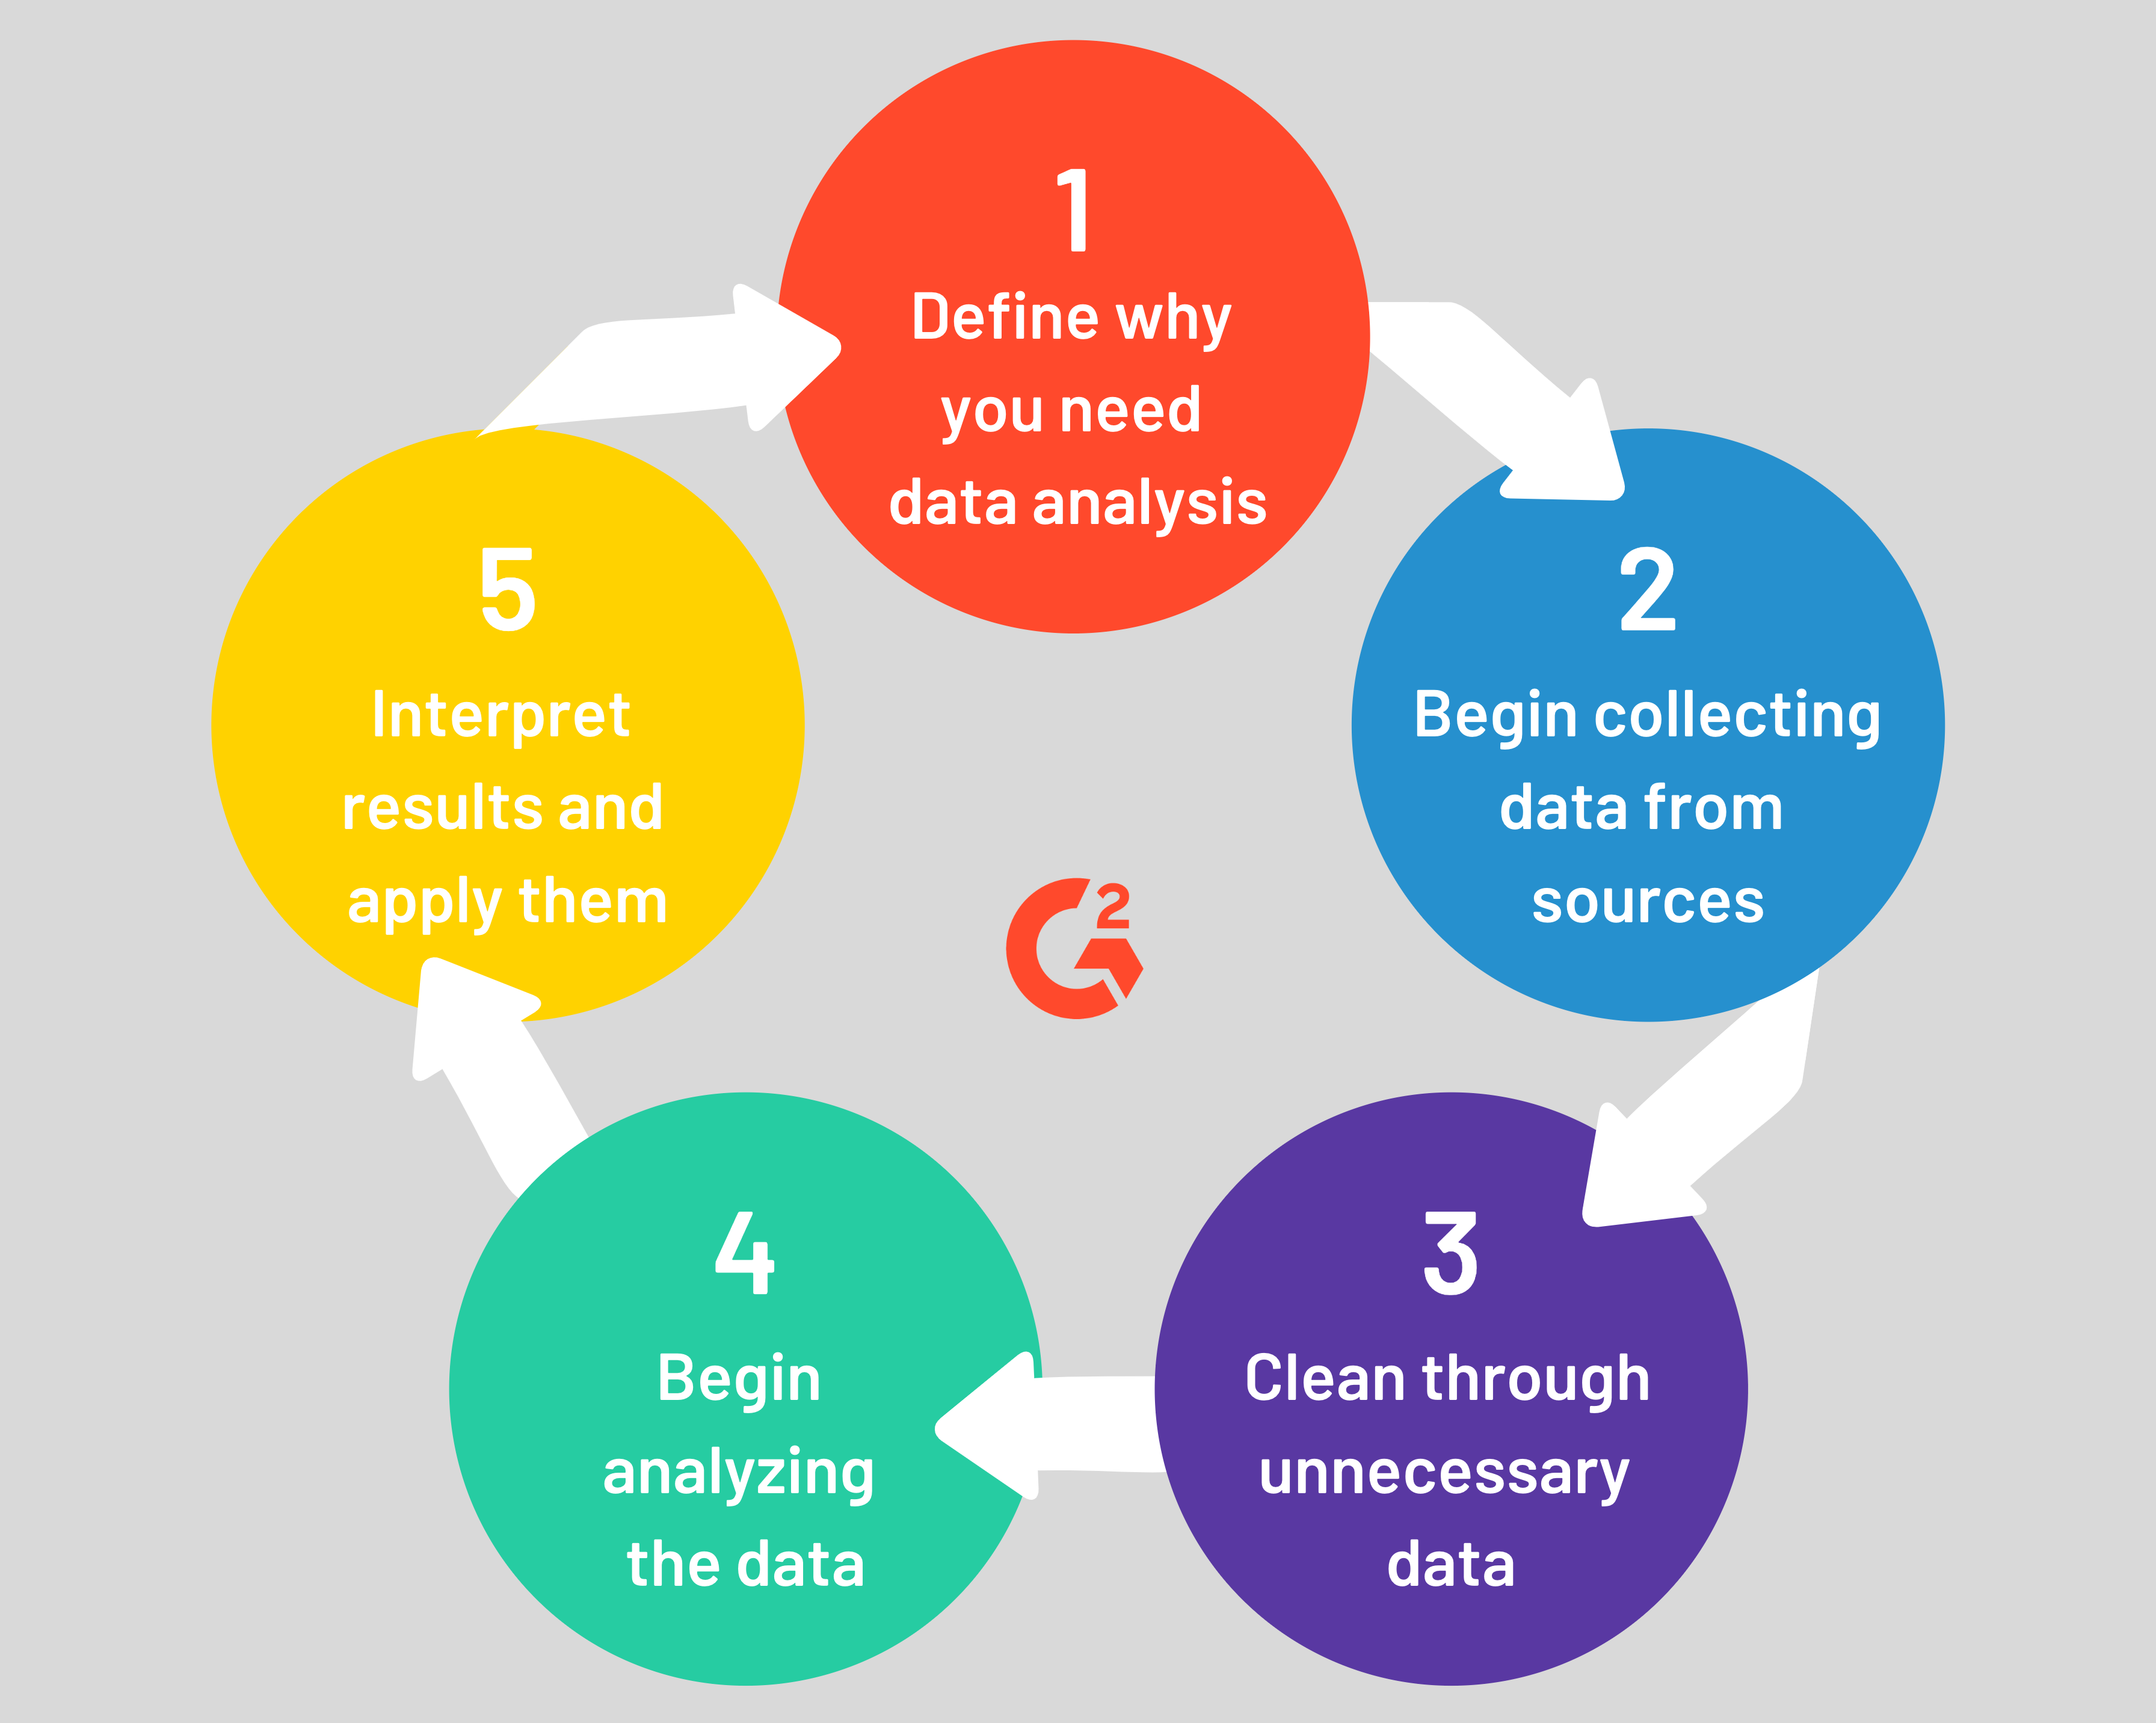
In statistics and mathematics, understanding relationships between variables is an essential part of data analysis. Two important statistical tools used to study these relationships are correlation and regression. These techniques help researchers determine whether variables are related and how one variable may influence another.

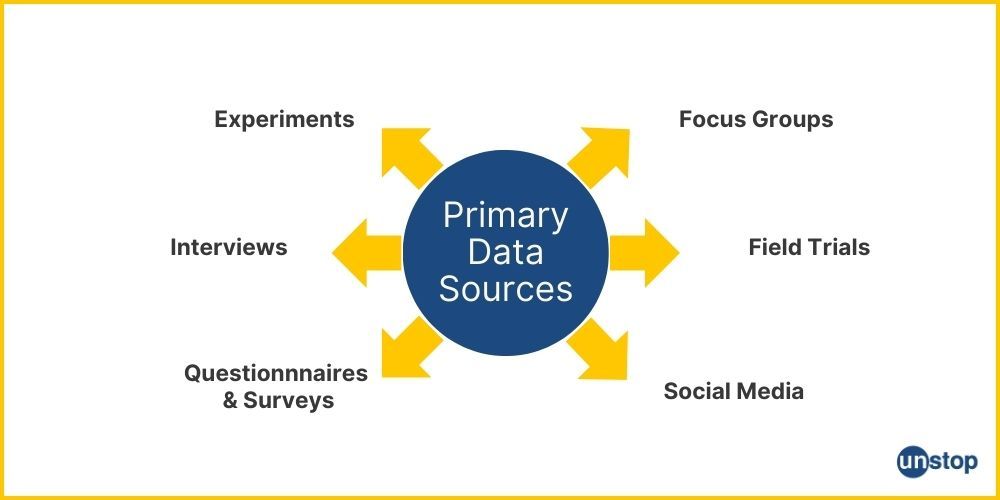
Correlation measures the strength and direction of a relationship between two variables, while regression is used to model the relationship and predict values of one variable based on another.

For example:

  • A researcher may study the relationship between hours studied and exam scores.
  • Economists may analyze the relationship between income and spending.
  • Businesses may analyze advertising expenditure and sales revenue.

In all these situations, correlation and regression help identify patterns and relationships within data.

These concepts are widely used in fields such as economics, engineering, finance, social sciences, medicine, and machine learning. They provide valuable insights into how variables interact and how changes in one variable affect another.

Understanding regression and correlation allows statisticians to interpret data more effectively and develop predictive models.


Understanding Correlation

Image
Image
Image
Image

Definition of Correlation

Correlation refers to the statistical relationship between two variables. It measures how strongly and in what direction the variables are related.

When two variables change together, they are said to be correlated.

Examples:

  • As temperature increases, ice cream sales increase.
  • As hours studied increase, exam scores tend to increase.
  • As price increases, demand may decrease.

Correlation helps determine whether there is a linear relationship between variables.

However, correlation does not imply causation. Two variables may be correlated without one causing the other.


Types of Correlation

Image
Image
Image
Image

There are three main types of correlation.

Positive Correlation

Positive correlation occurs when both variables increase together.

Example:

  • More hours studied → higher exam scores

In scatter plots, the data points trend upward.

Negative Correlation

Negative correlation occurs when one variable increases while the other decreases.

Example:

  • Higher prices → lower demand

In scatter plots, the data points trend downward.

Zero Correlation

Zero correlation occurs when there is no relationship between the variables.

Example:

  • Shoe size and intelligence.

In scatter plots, the points appear randomly distributed.


Correlation Coefficient

Image
Image
Image
Image

The strength of correlation is measured using the correlation coefficient, usually denoted by r.

The correlation coefficient ranges between −1 and +1.

Values of r indicate the following:

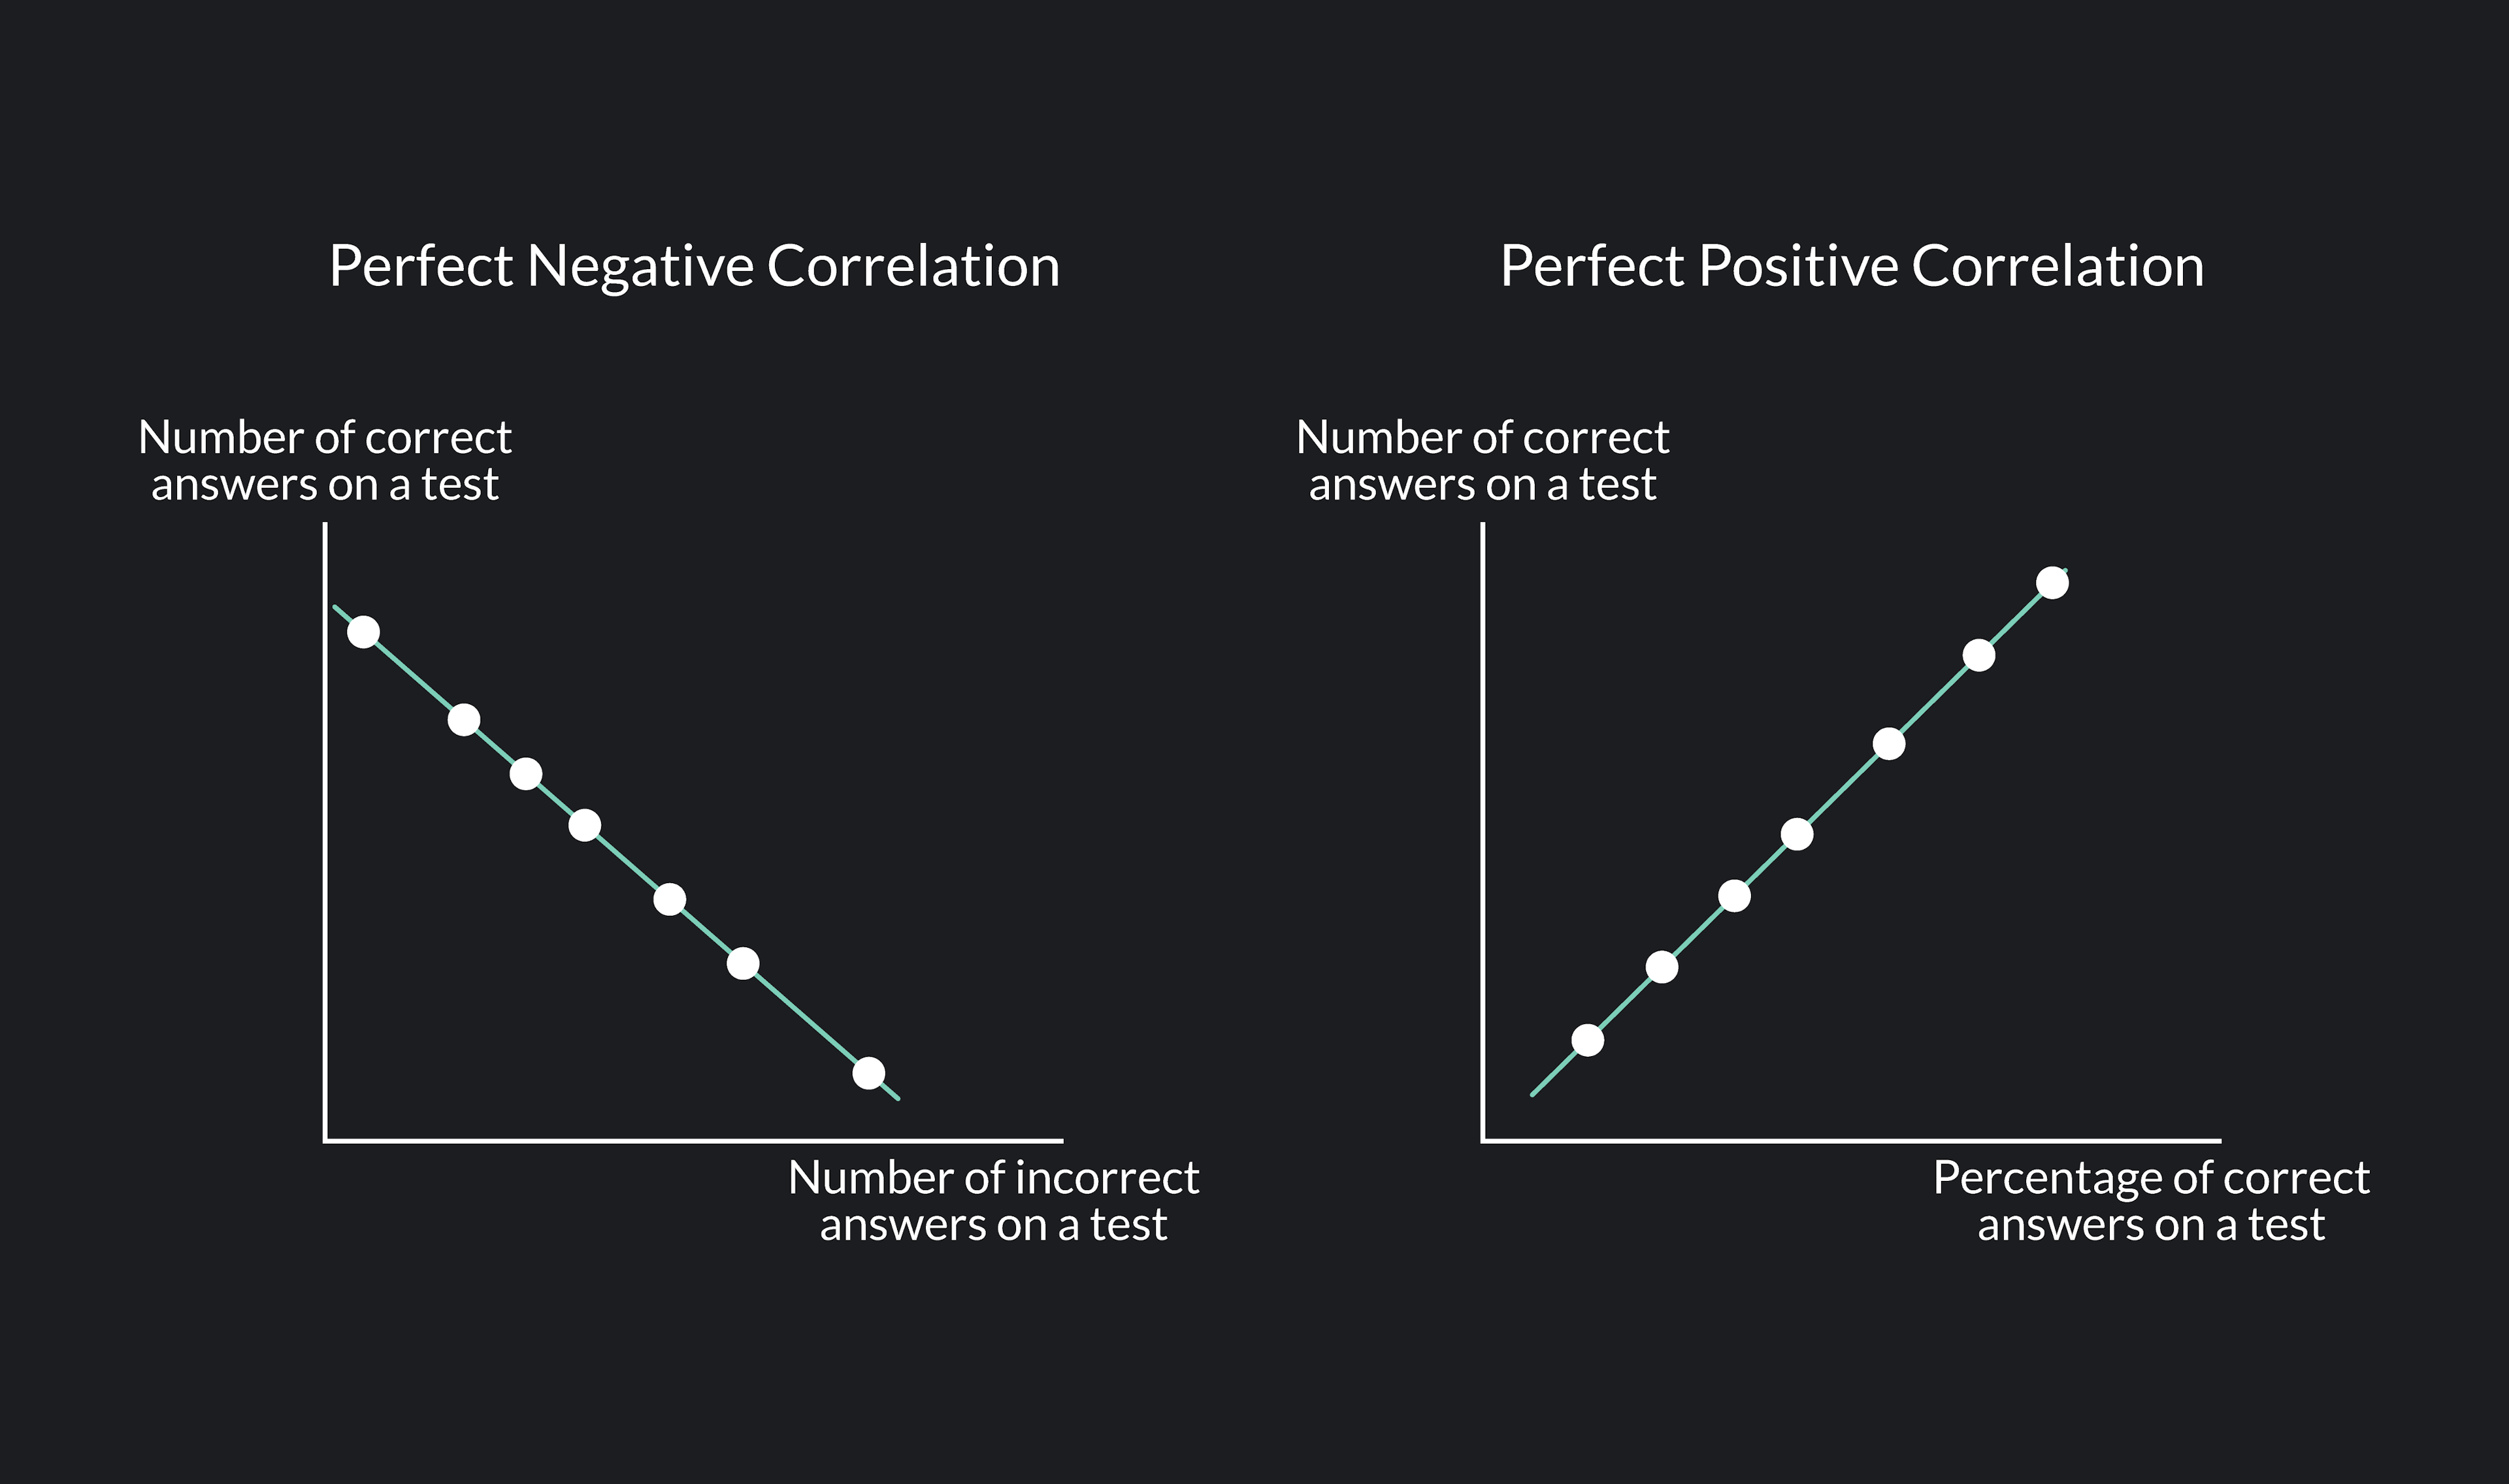
  • r = +1 → perfect positive correlation
  • r = −1 → perfect negative correlation
  • r = 0 → no correlation

Values closer to +1 or −1 indicate stronger relationships.

Pearson Correlation Coefficient

The Pearson correlation coefficient is calculated using the formula:

r = Σ[(x − x̄)(y − ȳ)] / √[Σ(x − x̄)² Σ(y − ȳ)²]

Where:

  • x and y represent variables
  • x̄ and ȳ represent means

This formula measures the linear relationship between two variables.


Scatter Diagrams

Image
Image
Image
Image

A scatter diagram is a graphical representation used to visualize the relationship between two variables.

In a scatter plot:

  • One variable is plotted on the x-axis.
  • The other variable is plotted on the y-axis.

Each point represents a pair of values.

Scatter diagrams help identify:

  • direction of correlation
  • strength of correlation
  • presence of outliers

They are often the first step in regression analysis.


Understanding Regression

Image
Image
Image
Image

Regression analysis is used to describe the relationship between variables and make predictions.

While correlation measures the strength of the relationship, regression determines the mathematical equation describing the relationship.

For example:

If a relationship exists between study hours and exam scores, regression can be used to predict exam scores based on study hours.

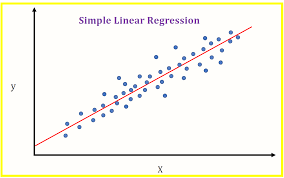
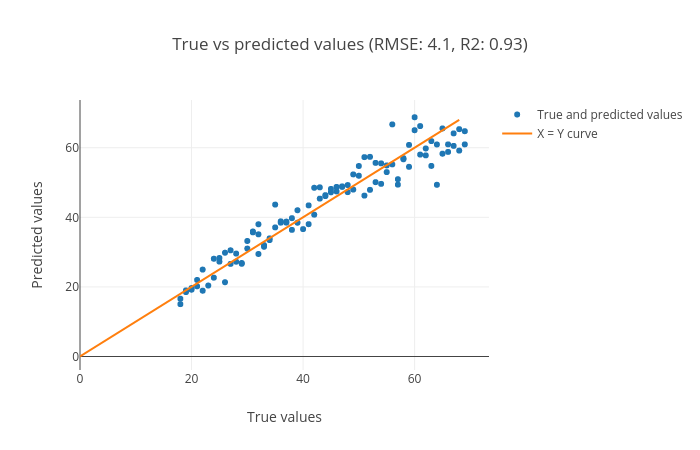
Regression analysis identifies the best-fit line that represents the relationship between variables.


Linear Regression

Image
Image
Image
Image

The most common form of regression is linear regression.

The linear regression equation is:

y = a + bx

Where:

  • y = dependent variable
  • x = independent variable
  • a = intercept
  • b = slope of the line

The slope represents how much y changes when x increases by one unit.

Regression uses the least squares method to determine the best-fitting line.


Multiple Regression

Image
Image
Image
Image

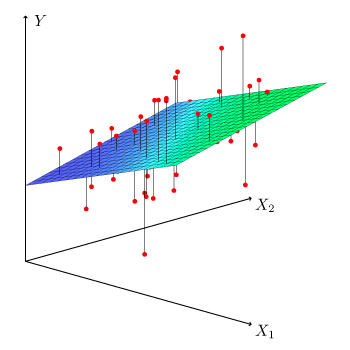
In many situations, a dependent variable depends on several independent variables.

Multiple regression models these relationships.

Example:

House price may depend on:

  • size of the house
  • location
  • number of bedrooms
  • age of the building

The multiple regression equation is:

y = a + b₁x₁ + b₂x₂ + … + bₙxₙ

Multiple regression is widely used in data science and predictive analytics.


Differences Between Correlation and Regression

Image
Image
Image
Image

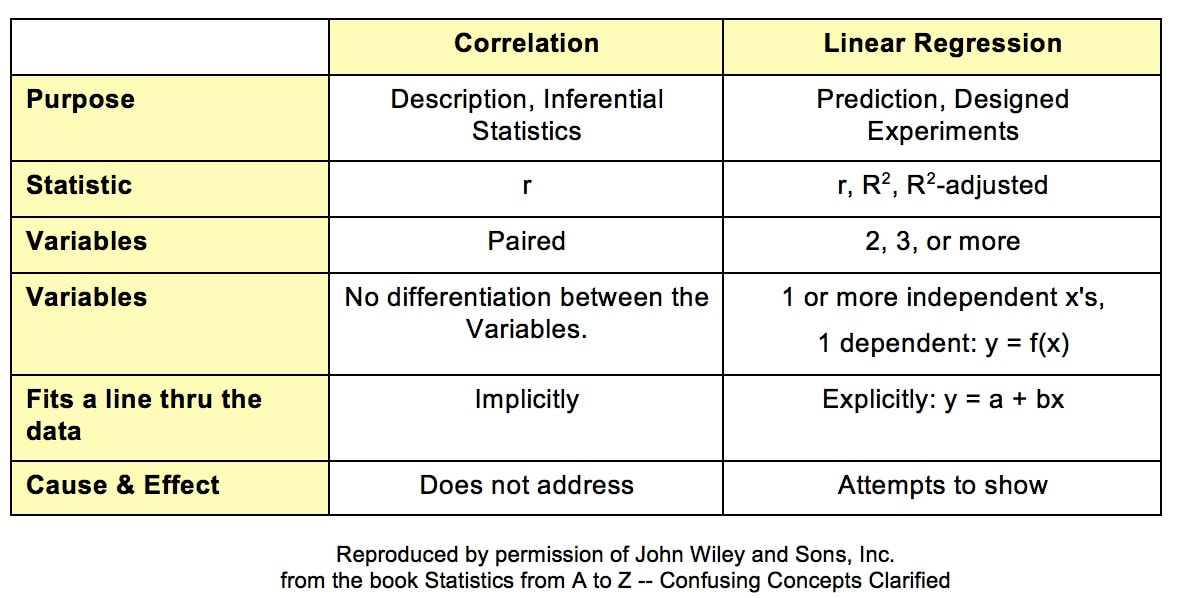
Although correlation and regression are related, they serve different purposes.
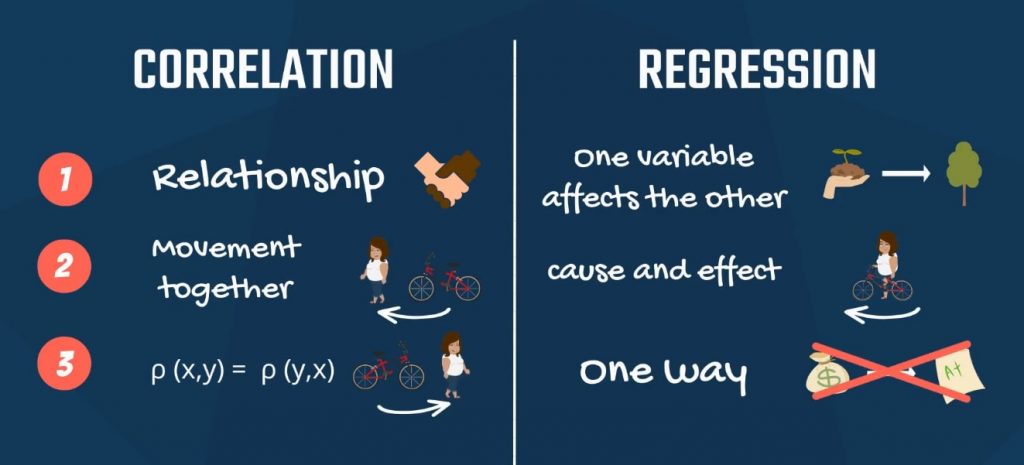
Correlation:

  • measures strength and direction of relationship
  • symmetric relationship
  • does not imply causation

Regression:

  • models the relationship mathematically
  • predicts values of one variable
  • distinguishes dependent and independent variables

Thus, correlation describes relationships while regression provides predictive models.


Applications of Regression and Correlation

Image
Image
Image
Image

Regression and correlation are used in many real-world applications.

Economics

Economists study relationships between income, consumption, and investment.

Business

Companies analyze advertising expenditure and sales revenue.

Finance

Investors study relationships between asset prices and market indicators.

Medicine

Researchers analyze relationships between lifestyle factors and health outcomes.

Data Science

Machine learning algorithms use regression models for prediction.

These techniques help analyze complex datasets and identify meaningful relationships.


Importance of Regression and Correlation

Regression and correlation are essential tools in statistical analysis.

They help researchers:

  • understand relationships between variables
  • predict future outcomes
  • identify trends in data
  • develop mathematical models

Without these tools, it would be difficult to analyze large datasets and extract useful insights.

These techniques form the foundation of modern statistical modeling.


Conclusion

Regression and correlation are powerful statistical methods used to analyze relationships between variables. Correlation measures the strength and direction of the relationship, while regression provides mathematical models for prediction.

These concepts play a crucial role in mathematics, statistics, economics, business analytics, data science, and scientific research. They allow researchers to analyze patterns, make predictions, and understand complex relationships in data.

By studying regression and correlation, students and researchers gain important analytical tools that help transform raw data into meaningful insights.


Tags

Variance and Standard Deviation in Statistics

Image
Image
Image
Image

Introduction to Variance and Standard Deviation

In statistics and mathematics, understanding the center of a dataset is important, but it is equally important to understand how the data values are spread around that center. Measures such as mean, median, and mode describe the central tendency of a dataset, while variance and standard deviation describe the dispersion or variability of the data.

Variance and standard deviation measure how much individual data values differ from the mean of the dataset. They help statisticians understand whether the data values are close to the average or widely spread out.

For example, consider two classes of students that both have the same average score of 70. In the first class, most students scored between 68 and 72, while in the second class, scores ranged from 40 to 100. Although the averages are the same, the variability in the second class is much greater. Variance and standard deviation help quantify this difference.

Variance and standard deviation are widely used in many fields including mathematics, economics, finance, engineering, social sciences, machine learning, and data science. They provide insight into the stability, consistency, and reliability of data.

These measures are fundamental components of statistical analysis and are essential for understanding probability distributions, hypothesis testing, and data modeling.


Concept of Dispersion

Image
Image
Image
Image

Before understanding variance and standard deviation, it is important to understand the concept of dispersion.

Dispersion refers to how much the values in a dataset vary or spread out around the central value.

If the values are close to the mean, the dispersion is low. If the values are far from the mean, the dispersion is high.

Several statistical measures describe dispersion:

  • Range
  • Quartile deviation
  • Mean deviation
  • Variance
  • Standard deviation

Among these measures, variance and standard deviation are the most widely used because they provide precise mathematical descriptions of variability.

Dispersion is important because it helps determine the reliability of the average value. Two datasets with the same mean may behave very differently depending on how spread out the data is.


Variance

Image
Image
Image
Image

Definition of Variance

Variance is a statistical measure that describes the average of the squared differences between each data point and the mean of the dataset.

It shows how far the data values are spread from the mean.

Mathematically, the variance of a dataset is calculated using the formula:

σ² = Σ (x − μ)² / N

Where:

  • σ² represents variance
  • x represents each data value
  • μ represents the mean
  • N represents the number of observations

For a sample dataset, the variance formula is:

s² = Σ (x − x̄)² / (n − 1)

Where:

  • s² = sample variance
  • x̄ = sample mean
  • n = number of observations

Variance measures the average squared deviation from the mean.


Example of Variance

Consider the dataset:

4, 6, 8, 10, 12

Step 1: Find the mean.

Mean = (4 + 6 + 8 + 10 + 12) / 5 = 8

Step 2: Find deviations from the mean.

4 − 8 = −4
6 − 8 = −2
8 − 8 = 0
10 − 8 = 2
12 − 8 = 4

Step 3: Square each deviation.

16, 4, 0, 4, 16

Step 4: Find the average.

Variance = (16 + 4 + 0 + 4 + 16) / 5 = 8

Thus, the variance is 8.

Variance gives an idea of how much the values vary from the mean.


Standard Deviation

Image
Image
Image
Image

Definition of Standard Deviation

Standard deviation is the square root of variance. It measures the average distance of data points from the mean.

Mathematically:

σ = √(σ²)

Where:

  • σ represents standard deviation
  • σ² represents variance

Standard deviation is easier to interpret than variance because it is expressed in the same units as the original data.


Example of Standard Deviation

Using the previous example:

Variance = 8

Standard deviation:

σ = √8 ≈ 2.83

Thus, the standard deviation is approximately 2.83.

This means the typical distance between the data values and the mean is about 2.83 units.


Population vs Sample Standard Deviation

Image
Image
Image
Image

In statistics, we distinguish between population and sample measurements.

Population Standard Deviation

Used when the entire population is studied.

Formula:

σ = √(Σ(x − μ)² / N)

Sample Standard Deviation

Used when analyzing a sample from the population.

Formula:

s = √(Σ(x − x̄)² / (n − 1))

The denominator (n − 1) is called Bessel’s correction, which improves the accuracy of sample estimates.


Interpretation of Standard Deviation

Image
Image
Image
Image

Standard deviation helps interpret how data is distributed around the mean.

In a normal distribution, the empirical rule applies:

  • 68% of data lies within 1 standard deviation of the mean.
  • 95% of data lies within 2 standard deviations.
  • 99.7% of data lies within 3 standard deviations.

This rule helps understand probability distributions.

A small standard deviation indicates that the data values are close to the mean, while a large standard deviation indicates that the data values are widely spread.


Properties of Variance and Standard Deviation

Variance and standard deviation have several important properties.

Non-Negative

Both variance and standard deviation are always greater than or equal to zero.

Dependence on Units

Variance uses squared units, while standard deviation uses the same units as the data.

Sensitivity to Outliers

Extreme values significantly affect variance and standard deviation.

Relationship with Mean

Both measures depend on the mean of the dataset.

These properties help statisticians understand how dispersion behaves in different datasets.


Applications of Variance and Standard Deviation

Image
Image
Image
Image

Variance and standard deviation are used in many real-world applications.

Finance

Investors use standard deviation to measure risk and volatility in financial markets.

Quality Control

Manufacturers analyze variability in production processes.

Data Science

Machine learning algorithms use variance to measure feature importance.

Scientific Research

Researchers analyze variability in experimental results.

Education

Standard deviation is used to measure the spread of exam scores.

These applications demonstrate the importance of understanding data variability.


Advantages of Variance and Standard Deviation

Variance and standard deviation provide several benefits.

  1. They measure data variability precisely.
  2. They use all observations in the dataset.
  3. They are widely applicable in statistical analysis.
  4. They form the basis of many advanced statistical methods.

These measures are essential tools in modern statistics.


Limitations of Variance and Standard Deviation

Despite their usefulness, these measures have some limitations.

  1. They are affected by extreme values.
  2. Variance is difficult to interpret because of squared units.
  3. They assume numerical data and cannot be used for categorical variables.

Despite these limitations, they remain essential tools in statistical analysis.


Importance in Statistical Analysis

Variance and standard deviation are fundamental in many statistical methods.

They are used in:

  • probability distributions
  • hypothesis testing
  • regression analysis
  • statistical modeling
  • machine learning algorithms

Without these measures, it would be difficult to analyze variability and uncertainty in data.


Conclusion

Variance and standard deviation are essential measures of dispersion in statistics that describe how data values spread around the mean. Variance measures the average squared deviation from the mean, while standard deviation represents the square root of variance and indicates the typical distance of data points from the mean.

These measures provide valuable insights into the variability and consistency of datasets. They are widely used in fields such as finance, engineering, economics, science, and data analysis.

Understanding variance and standard deviation helps researchers and analysts interpret data more effectively and draw meaningful conclusions from statistical studies. They form a crucial part of statistical analysis and are fundamental tools for studying data variability.


Tags

Mean, Median, and Mode in Statistics

Image
Image
Image

Introduction to Measures of Central Tendency

In statistics and mathematics, large sets of numerical data are often summarized using representative values. These representative values help describe the overall characteristics of the dataset in a simple and understandable way. One of the most important statistical concepts used for summarizing data is measures of central tendency.

Measures of central tendency indicate the central or typical value around which data points tend to cluster. Instead of analyzing every individual observation in a dataset, these measures provide a single value that represents the entire dataset.

The three main measures of central tendency are:

  • Mean
  • Median
  • Mode

Each of these measures describes the center of a dataset in a different way. Understanding the differences between them helps statisticians choose the most appropriate measure depending on the type of data being analyzed.

Measures of central tendency are widely used in fields such as economics, business, education, medicine, psychology, engineering, and social sciences. For example, the average marks of students in a class, the median income in a population, and the most common product sold in a store are all examples of central tendency measures.


Understanding Mean

Image
Image
Image
Image

Definition of Mean

The mean is the most commonly used measure of central tendency. It is often referred to as the average. The mean is calculated by adding all the values in a dataset and dividing the sum by the number of values.

Mathematically, the mean is expressed as:

Mean = (Sum of observations) / (Number of observations)

If the dataset consists of values:

x₁, x₂, x₃, …, xₙ

Then the mean is:

x̄ = (x₁ + x₂ + x₃ + … + xₙ) / n

Where:

  • x̄ represents the mean
  • n represents the number of observations

The mean gives an overall idea of the typical value in the dataset.


Example of Mean

Consider the dataset representing marks obtained by five students:

70, 75, 80, 85, 90

Step 1: Add all the values

70 + 75 + 80 + 85 + 90 = 400

Step 2: Divide by the number of values

Mean = 400 / 5 = 80

Thus, the average mark is 80.

This means the typical performance of students in the class is around 80 marks.


Types of Mean

There are different types of means used in statistics.

Arithmetic Mean

The arithmetic mean is the most commonly used type.

Formula:

x̄ = Σx / n

Weighted Mean

In some cases, different observations have different levels of importance.

Formula:

Weighted Mean = Σ(wx) / Σw

Where:

  • w represents weights
  • x represents observations

Geometric Mean

Used in growth rates and financial calculations.

Formula:

GM = (x₁ × x₂ × x₃ × … × xₙ)^(1/n)

Harmonic Mean

Used in situations involving rates such as speed.

Formula:

HM = n / (Σ(1/x))

Each type of mean has specific applications depending on the type of data.


Advantages of Mean

The mean has several advantages.

  1. It uses all observations in the dataset.
  2. It is easy to calculate and understand.
  3. It provides a clear mathematical representation of the dataset.
  4. It is widely used in statistical analysis.

However, the mean also has some limitations.


Limitations of Mean

The mean is affected by extreme values, also known as outliers.

Example dataset:

10, 12, 15, 18, 100

The mean becomes much larger because of the value 100.

Thus, the mean may not always represent the typical value accurately.


Understanding Median

Image
Image
Image
Image

Definition of Median

The median is the middle value of a dataset when the values are arranged in ascending or descending order.

The median divides the dataset into two equal halves.

Half of the observations lie below the median, and the other half lie above it.


Finding Median for Odd Number of Observations

Example dataset:

5, 8, 12, 15, 20

The middle value is 12.

Thus:

Median = 12


Finding Median for Even Number of Observations

Example dataset:

6, 9, 12, 15

The middle values are 9 and 12.

Median = (9 + 12) / 2

Median = 10.5


Median in Grouped Data

For grouped data, the median can be calculated using the formula:

Median = L + [(N/2 − CF) / f] × h

Where:

  • L = lower boundary of median class
  • N = total frequency
  • CF = cumulative frequency of previous class
  • f = frequency of median class
  • h = class width

This formula is used in frequency distributions.


Advantages of Median

The median has several benefits.

  1. It is not affected by extreme values.
  2. It is suitable for skewed distributions.
  3. It is useful for ordinal data.

For example, median income is often used instead of mean income because extreme values can distort averages.


Limitations of Median

Despite its advantages, the median also has limitations.

  1. It does not use all data values.
  2. It cannot be easily used in algebraic calculations.

Nevertheless, the median is very useful for many statistical analyses.


Understanding Mode

Image
Image
Image
Image

Definition of Mode

The mode is the value that appears most frequently in a dataset.

It represents the most common observation.

Example dataset:

4, 6, 7, 7, 8, 9

Here:

Mode = 7

Because 7 appears most frequently.


Types of Mode

A dataset can have different types of modes.

Unimodal

Only one value occurs most frequently.

Bimodal

Two values occur with the highest frequency.

Example:

3, 5, 5, 7, 7, 9

Modes: 5 and 7

Multimodal

More than two values occur with the same highest frequency.


Mode in Grouped Data

For grouped data, the mode can be calculated using the formula:

Mode = L + [(f₁ − f₀) / (2f₁ − f₀ − f₂)] × h

Where:

  • L = lower boundary of modal class
  • f₁ = frequency of modal class
  • f₀ = frequency of preceding class
  • f₂ = frequency of succeeding class
  • h = class width

The modal class is the class interval with the highest frequency.


Relationship Between Mean, Median, and Mode

Image
Image
Image
Image

In a normal distribution, the mean, median, and mode are equal.

Mean = Median = Mode

However, in skewed distributions, they differ.

Positively Skewed Distribution

Mean > Median > Mode

Negatively Skewed Distribution

Mean < Median < Mode

There is also an empirical relationship:

Mode = 3Median − 2Mean

This relationship is useful for estimating one measure when others are known.


Applications of Mean, Median, and Mode

Image
Image
Image
Image

Measures of central tendency are used in many fields.

Education

Teachers use the mean to calculate average student scores.

Economics

Median income is used to understand economic conditions.

Business

Companies analyze average sales and most popular products.

Healthcare

Medical researchers use averages to study health trends.

Social Sciences

Researchers analyze survey data using measures of central tendency.


Importance of Measures of Central Tendency

Measures of central tendency simplify complex datasets.

They help researchers understand:

  • the general trend of data
  • comparisons between datasets
  • patterns and distributions

Without these measures, analyzing large datasets would be difficult.

They also serve as the foundation for advanced statistical methods.


Conclusion

Mean, median, and mode are three fundamental measures of central tendency used in statistics to summarize and analyze datasets. Each measure provides a different perspective on the center of a dataset.

The mean represents the average value, the median represents the middle value, and the mode represents the most frequently occurring value. While the mean uses all data points, the median and mode are often more useful when data contains extreme values or categorical information.

Understanding these measures allows statisticians and researchers to interpret data effectively and draw meaningful conclusions. These concepts are essential tools in mathematics, statistics, economics, science, and many other fields.

By studying mean, median, and mode, students gain valuable insights into how data behaves and how statistical analysis can be used to make informed decisions.


Tags

Data Collection in Mathematics and Statistics

Image
Image
Image
Image

Introduction to Data Collection

Data collection is a fundamental process in statistics and mathematics that involves gathering information for analysis and interpretation. It forms the foundation of statistical studies, research investigations, and decision-making processes in various fields such as science, economics, business, engineering, medicine, and social sciences.

In mathematics and statistics, data refers to numerical or categorical information collected for the purpose of analysis. Without reliable and accurate data, statistical methods cannot produce meaningful conclusions. Therefore, data collection is a crucial first step in any statistical investigation.

Data collection helps researchers answer important questions such as:

  • What patterns exist in a dataset?
  • What trends are occurring over time?
  • What relationships exist between variables?
  • How can future outcomes be predicted?

For example, a government might collect data about population growth, a business may collect data about customer preferences, and a scientist may collect data from experiments to test hypotheses.

The effectiveness of statistical analysis depends greatly on the quality of the data collected. Accurate and well-organized data ensures that conclusions drawn from the analysis are reliable and meaningful.


Meaning of Data

Image
Image
Image
Image

The word data refers to raw facts, observations, or measurements collected for analysis.

Data can represent many types of information such as:

  • numbers
  • measurements
  • categories
  • responses
  • observations

Data is usually collected in order to understand patterns, relationships, or trends.

Types of Data

Data can be broadly classified into two types:

Quantitative Data

Quantitative data consists of numerical values that can be measured or counted.

Examples:

  • height of students
  • temperature readings
  • exam scores
  • income levels

Quantitative data can be further divided into:

  1. Discrete data
  2. Continuous data

Qualitative Data

Qualitative data consists of descriptive or categorical information.

Examples:

  • gender
  • color
  • type of vehicle
  • occupation

Qualitative data helps describe characteristics rather than measure quantities.


Importance of Data Collection

Image
Image
Image
Image

Data collection plays an essential role in statistical analysis and research.

Some important reasons for collecting data include:

Understanding Patterns

Data helps identify patterns and trends that would otherwise remain hidden.

Supporting Decision Making

Organizations rely on data to make informed decisions.

Testing Hypotheses

Scientific research uses collected data to verify or reject hypotheses.

Predicting Future Trends

Statistical models use historical data to forecast future outcomes.

Improving Systems

Data analysis can help improve processes in industries such as manufacturing, healthcare, and transportation.

Without proper data collection, statistical analysis cannot produce meaningful insights.


Methods of Data Collection

Image
Image
Image
Image

There are several methods used to collect data depending on the purpose of the study.

Observation Method

In this method, data is collected by observing events or behaviors.

Example:

A researcher may observe traffic patterns at a busy intersection.

Survey Method

Surveys involve collecting responses from individuals through questionnaires or interviews.

Example:

A company may conduct a customer satisfaction survey.

Interview Method

Interviews involve direct interaction with respondents.

Example:

Researchers may interview participants to gather detailed information.

Experiment Method

In experimental studies, researchers collect data by performing controlled experiments.

Example:

A scientist may conduct an experiment to test the effectiveness of a new medicine.

Each method has advantages and disadvantages depending on the research objective.


Primary and Secondary Data

Image
Image
Image
Image

Data can be classified into two main categories based on its source.

Primary Data

Primary data is collected directly by the researcher for a specific purpose.

Examples:

  • surveys
  • experiments
  • interviews
  • observations

Primary data is usually more reliable because it is collected specifically for the study.

Secondary Data

Secondary data is data that has already been collected by someone else.

Examples:

  • government reports
  • census data
  • research publications
  • statistical databases

Secondary data is easier and less expensive to obtain, but it may not always perfectly match the research objective.


Sampling Techniques

Image
Image
Image
Image

When collecting data, it is often impractical to study an entire population. Instead, researchers study a sample.

A sample is a smaller subset of the population.

Simple Random Sampling

Each member of the population has an equal chance of being selected.

Stratified Sampling

The population is divided into groups called strata, and samples are selected from each group.

Systematic Sampling

Every nth element of the population is selected.

Cluster Sampling

The population is divided into clusters, and entire clusters are randomly selected.

Sampling techniques help researchers collect data efficiently while maintaining accuracy.


Data Collection Tools

Image
Image
Image
Image

Various tools are used to collect data.

Questionnaires

Written sets of questions used to gather responses from participants.

Checklists

Lists used to record observations or events.

Measurement Instruments

Devices such as thermometers, scales, and sensors.

Digital Tools

Modern research often uses online forms, mobile applications, and automated data collection systems.

These tools help ensure accurate and efficient data collection.


Challenges in Data Collection

Image
Image
Image
Image

Despite its importance, data collection faces several challenges.

Sampling Bias

Occurs when the sample does not accurately represent the population.

Measurement Errors

Incorrect instruments or methods may produce inaccurate data.

Non-response

Some individuals may refuse to participate in surveys.

Data Inconsistency

Incomplete or inconsistent data can affect analysis.

Researchers must carefully design studies to minimize these problems.


Data Organization After Collection

Image
Image
Image
Image

After data is collected, it must be organized and summarized.

Common methods include:

Tables

Organizing data in rows and columns.

Frequency Distribution

Showing how often each value occurs.

Graphs and Charts

Visual representations such as:

  • bar charts
  • pie charts
  • histograms
  • line graphs

Data organization helps make analysis easier and clearer.


Applications of Data Collection

Image
Image
Image
Image

Data collection is used in many fields.

Business

Companies collect data about customers, sales, and market trends.

Healthcare

Medical researchers collect patient data to study diseases.

Education

Schools collect data about student performance.

Government

Governments collect census data to understand population trends.

Science

Scientists collect experimental data to test theories.

These applications demonstrate the importance of accurate data collection.


Importance of Data Collection in Mathematics and Statistics

Data collection is the starting point of the statistical process.

It enables mathematicians and statisticians to:

  • analyze patterns
  • test theories
  • develop models
  • make predictions

Good data collection practices improve the reliability of statistical results and ensure accurate conclusions.

Without proper data collection, statistical analysis cannot provide meaningful insights.


Conclusion

Data collection is a fundamental process in mathematics and statistics that involves gathering information for analysis and interpretation. It forms the basis of statistical studies and plays a crucial role in research, decision-making, and scientific investigations.

Various methods such as surveys, observations, interviews, and experiments are used to collect data. Data can be classified into primary and secondary data depending on its source, and sampling techniques help researchers study populations efficiently.

Accurate data collection allows researchers to identify patterns, analyze trends, and develop models that describe real-world phenomena. Because of its importance in science, business, healthcare, and government, data collection remains a critical component of modern research and statistical analysis.

Understanding data collection helps students and researchers build strong foundations in statistics and develop skills for analyzing information effectively.


Tags