


Introduction to Measures of Central Tendency
In statistics and mathematics, large sets of numerical data are often summarized using representative values. These representative values help describe the overall characteristics of the dataset in a simple and understandable way. One of the most important statistical concepts used for summarizing data is measures of central tendency.
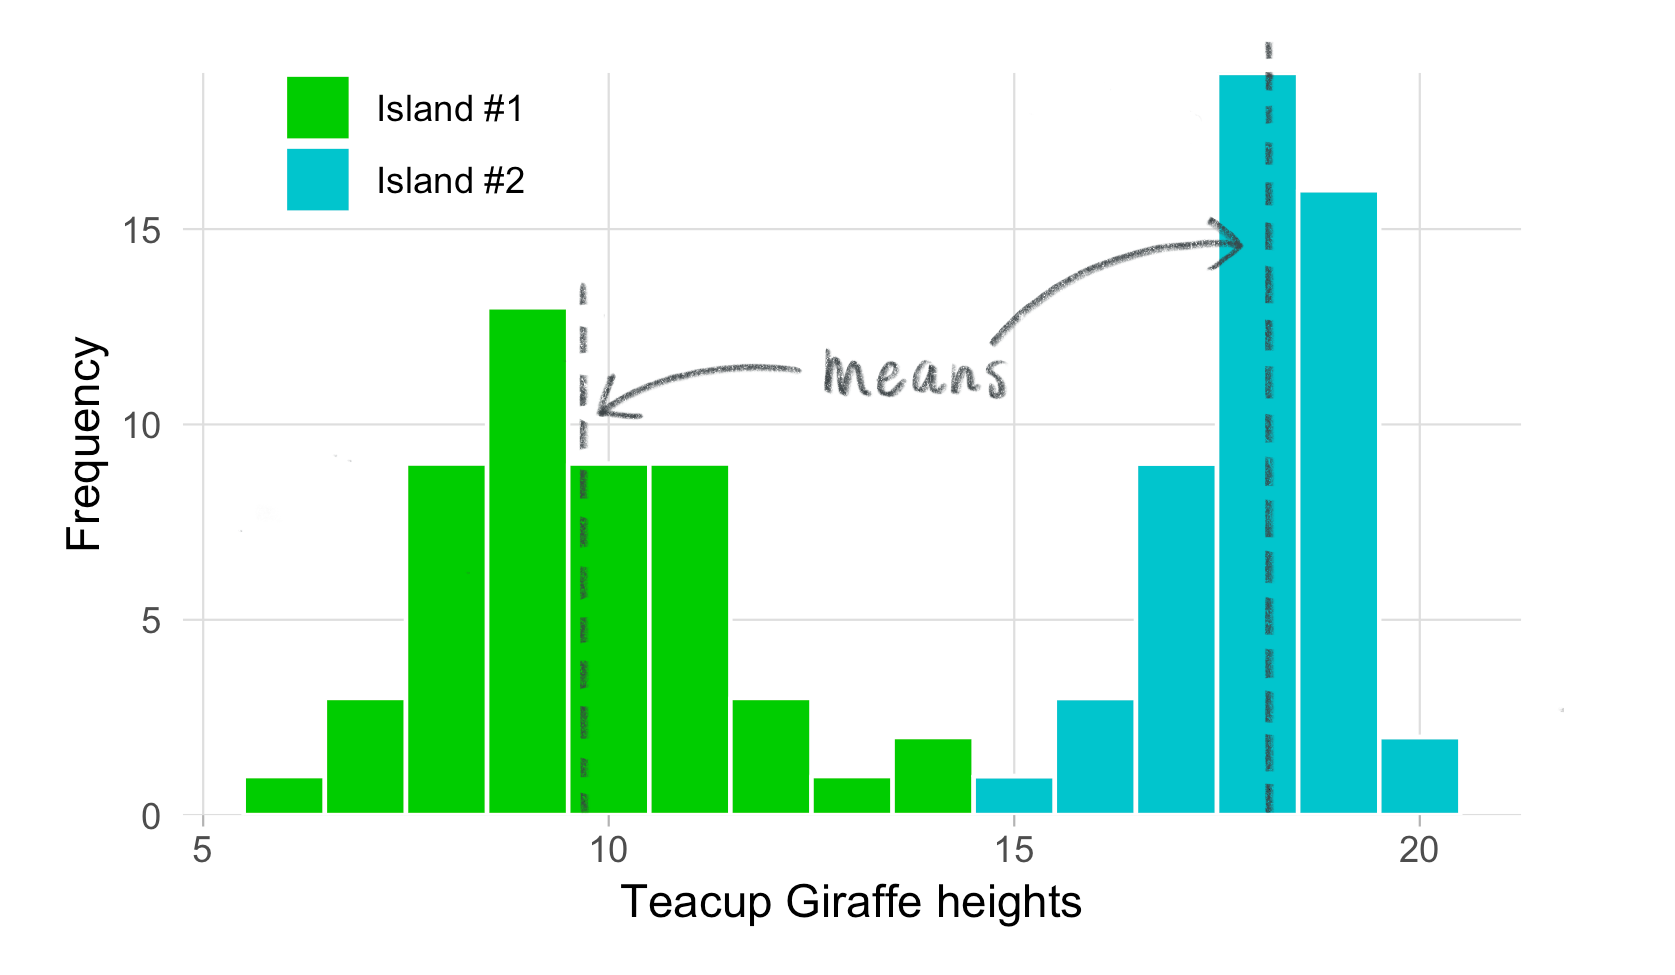
Measures of central tendency indicate the central or typical value around which data points tend to cluster. Instead of analyzing every individual observation in a dataset, these measures provide a single value that represents the entire dataset.
The three main measures of central tendency are:
- Mean
- Median
- Mode
Each of these measures describes the center of a dataset in a different way. Understanding the differences between them helps statisticians choose the most appropriate measure depending on the type of data being analyzed.
Measures of central tendency are widely used in fields such as economics, business, education, medicine, psychology, engineering, and social sciences. For example, the average marks of students in a class, the median income in a population, and the most common product sold in a store are all examples of central tendency measures.
Understanding Mean
Definition of Mean
The mean is the most commonly used measure of central tendency. It is often referred to as the average. The mean is calculated by adding all the values in a dataset and dividing the sum by the number of values.
Mathematically, the mean is expressed as:
Mean = (Sum of observations) / (Number of observations)
If the dataset consists of values:
x₁, x₂, x₃, …, xₙ
Then the mean is:
x̄ = (x₁ + x₂ + x₃ + … + xₙ) / n
Where:
- x̄ represents the mean
- n represents the number of observations
The mean gives an overall idea of the typical value in the dataset.
Example of Mean
Consider the dataset representing marks obtained by five students:
70, 75, 80, 85, 90
Step 1: Add all the values
70 + 75 + 80 + 85 + 90 = 400
Step 2: Divide by the number of values
Mean = 400 / 5 = 80
Thus, the average mark is 80.
This means the typical performance of students in the class is around 80 marks.
Types of Mean
There are different types of means used in statistics.
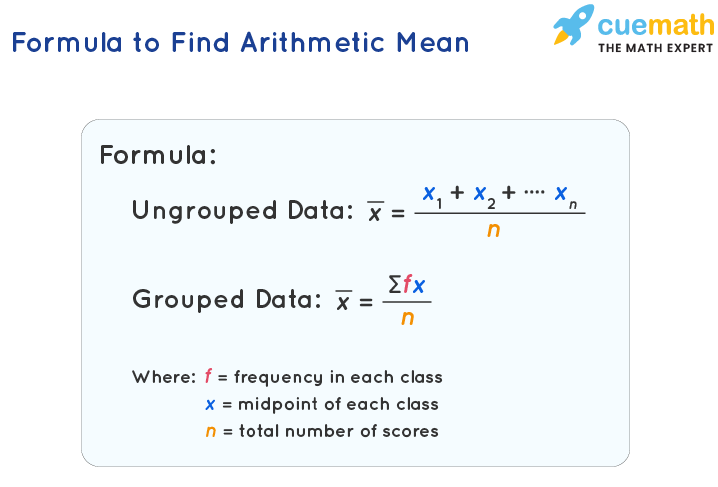
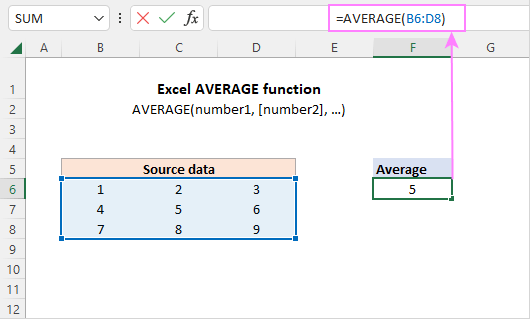
Arithmetic Mean
The arithmetic mean is the most commonly used type.
Formula:
x̄ = Σx / n
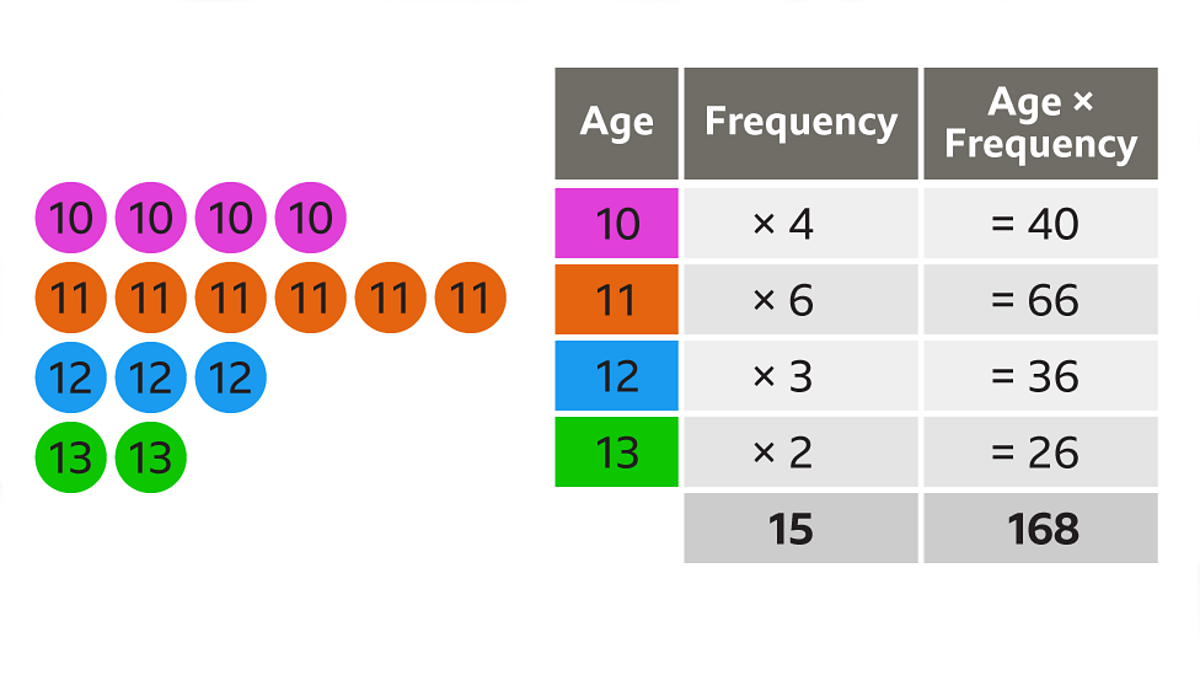
Weighted Mean
In some cases, different observations have different levels of importance.
Formula:
Weighted Mean = Σ(wx) / Σw
Where:
- w represents weights
- x represents observations
Geometric Mean
Used in growth rates and financial calculations.
Formula:
GM = (x₁ × x₂ × x₃ × … × xₙ)^(1/n)
Harmonic Mean
Used in situations involving rates such as speed.
Formula:
HM = n / (Σ(1/x))
Each type of mean has specific applications depending on the type of data.
Advantages of Mean
The mean has several advantages.
- It uses all observations in the dataset.
- It is easy to calculate and understand.
- It provides a clear mathematical representation of the dataset.
- It is widely used in statistical analysis.
However, the mean also has some limitations.
Limitations of Mean
The mean is affected by extreme values, also known as outliers.
Example dataset:
10, 12, 15, 18, 100
The mean becomes much larger because of the value 100.
Thus, the mean may not always represent the typical value accurately.
Understanding Median


Definition of Median
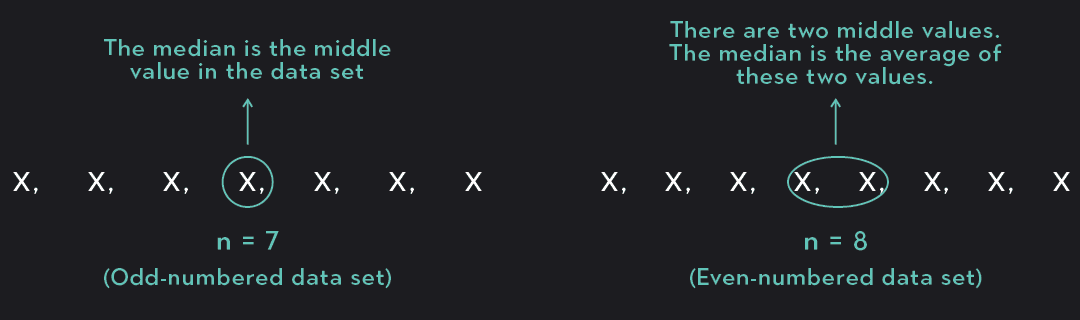
The median is the middle value of a dataset when the values are arranged in ascending or descending order.
The median divides the dataset into two equal halves.
Half of the observations lie below the median, and the other half lie above it.
Finding Median for Odd Number of Observations
Example dataset:
5, 8, 12, 15, 20
The middle value is 12.
Thus:
Median = 12
Finding Median for Even Number of Observations
Example dataset:
6, 9, 12, 15
The middle values are 9 and 12.
Median = (9 + 12) / 2
Median = 10.5
Median in Grouped Data
For grouped data, the median can be calculated using the formula:
Median = L + [(N/2 − CF) / f] × h
Where:
- L = lower boundary of median class
- N = total frequency
- CF = cumulative frequency of previous class
- f = frequency of median class
- h = class width
This formula is used in frequency distributions.
Advantages of Median
The median has several benefits.
- It is not affected by extreme values.
- It is suitable for skewed distributions.
- It is useful for ordinal data.
For example, median income is often used instead of mean income because extreme values can distort averages.
Limitations of Median
Despite its advantages, the median also has limitations.
- It does not use all data values.
- It cannot be easily used in algebraic calculations.
Nevertheless, the median is very useful for many statistical analyses.
Understanding Mode


Definition of Mode
The mode is the value that appears most frequently in a dataset.
It represents the most common observation.
Example dataset:
4, 6, 7, 7, 8, 9
Here:
Mode = 7
Because 7 appears most frequently.
Types of Mode
A dataset can have different types of modes.
Unimodal
Only one value occurs most frequently.
Bimodal
Two values occur with the highest frequency.
Example:
3, 5, 5, 7, 7, 9
Modes: 5 and 7
Multimodal
More than two values occur with the same highest frequency.
Mode in Grouped Data
For grouped data, the mode can be calculated using the formula:
Mode = L + [(f₁ − f₀) / (2f₁ − f₀ − f₂)] × h
Where:
- L = lower boundary of modal class
- f₁ = frequency of modal class
- f₀ = frequency of preceding class
- f₂ = frequency of succeeding class
- h = class width
The modal class is the class interval with the highest frequency.
Relationship Between Mean, Median, and Mode

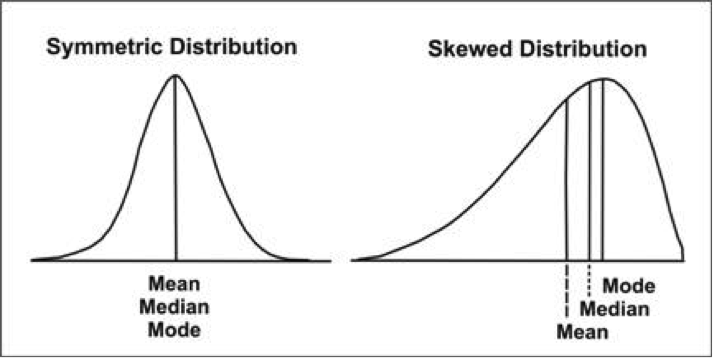


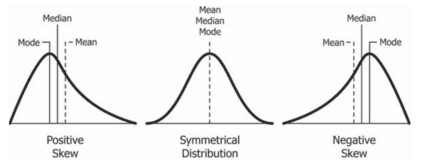
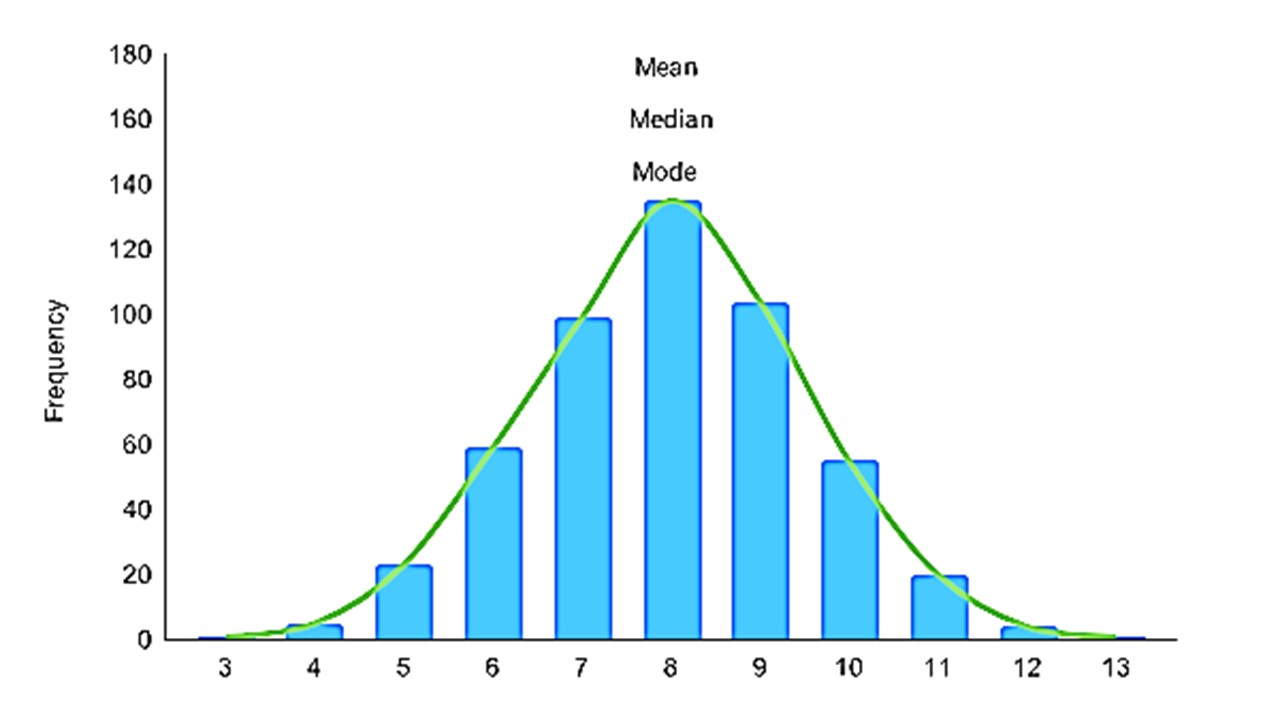
In a normal distribution, the mean, median, and mode are equal.
Mean = Median = Mode
However, in skewed distributions, they differ.
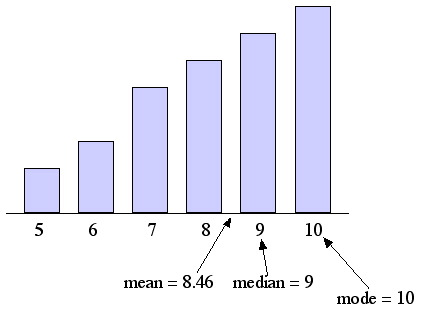
Positively Skewed Distribution
Mean > Median > Mode
Negatively Skewed Distribution
Mean < Median < Mode
There is also an empirical relationship:
Mode = 3Median − 2Mean
This relationship is useful for estimating one measure when others are known.
Applications of Mean, Median, and Mode


Measures of central tendency are used in many fields.
Education
Teachers use the mean to calculate average student scores.
Economics
Median income is used to understand economic conditions.
Business
Companies analyze average sales and most popular products.
Healthcare
Medical researchers use averages to study health trends.
Social Sciences
Researchers analyze survey data using measures of central tendency.
Importance of Measures of Central Tendency
Measures of central tendency simplify complex datasets.
They help researchers understand:
- the general trend of data
- comparisons between datasets
- patterns and distributions
Without these measures, analyzing large datasets would be difficult.
They also serve as the foundation for advanced statistical methods.
Conclusion
Mean, median, and mode are three fundamental measures of central tendency used in statistics to summarize and analyze datasets. Each measure provides a different perspective on the center of a dataset.
The mean represents the average value, the median represents the middle value, and the mode represents the most frequently occurring value. While the mean uses all data points, the median and mode are often more useful when data contains extreme values or categorical information.
Understanding these measures allows statisticians and researchers to interpret data effectively and draw meaningful conclusions. These concepts are essential tools in mathematics, statistics, economics, science, and many other fields.
By studying mean, median, and mode, students gain valuable insights into how data behaves and how statistical analysis can be used to make informed decisions.